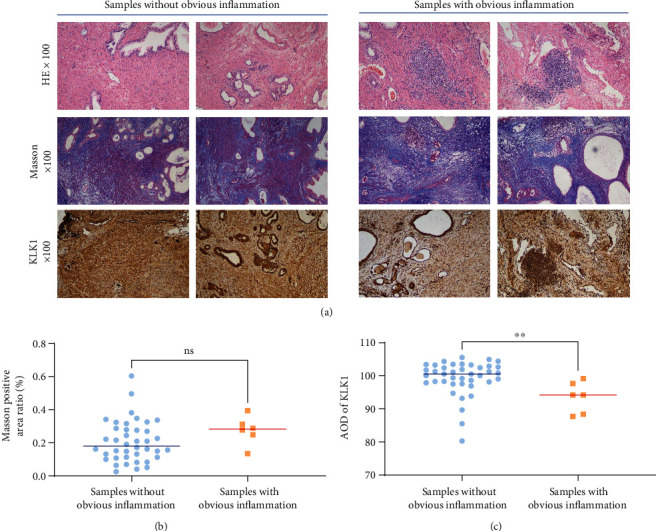
Figure 6.

The effect of inflammation on the expression of KLK1 and fibrosis in the prostate of BPH patients. (a) Representative H&E photos, Masson photos, and KLK1 IHC photos of the prostate tissue from patients undergoing BPH surgery (upper, H&E, magnification ×100; middle, Masson, magnification ×100; and lower, IHC, magnification ×100). (b) Statistical analysis of the positive area ratio of Masson staining. ns, P > 0.05. (c) Statistical analysis of the AOD quantification of KLK1 according to IHC. ∗∗P < 0.01.
