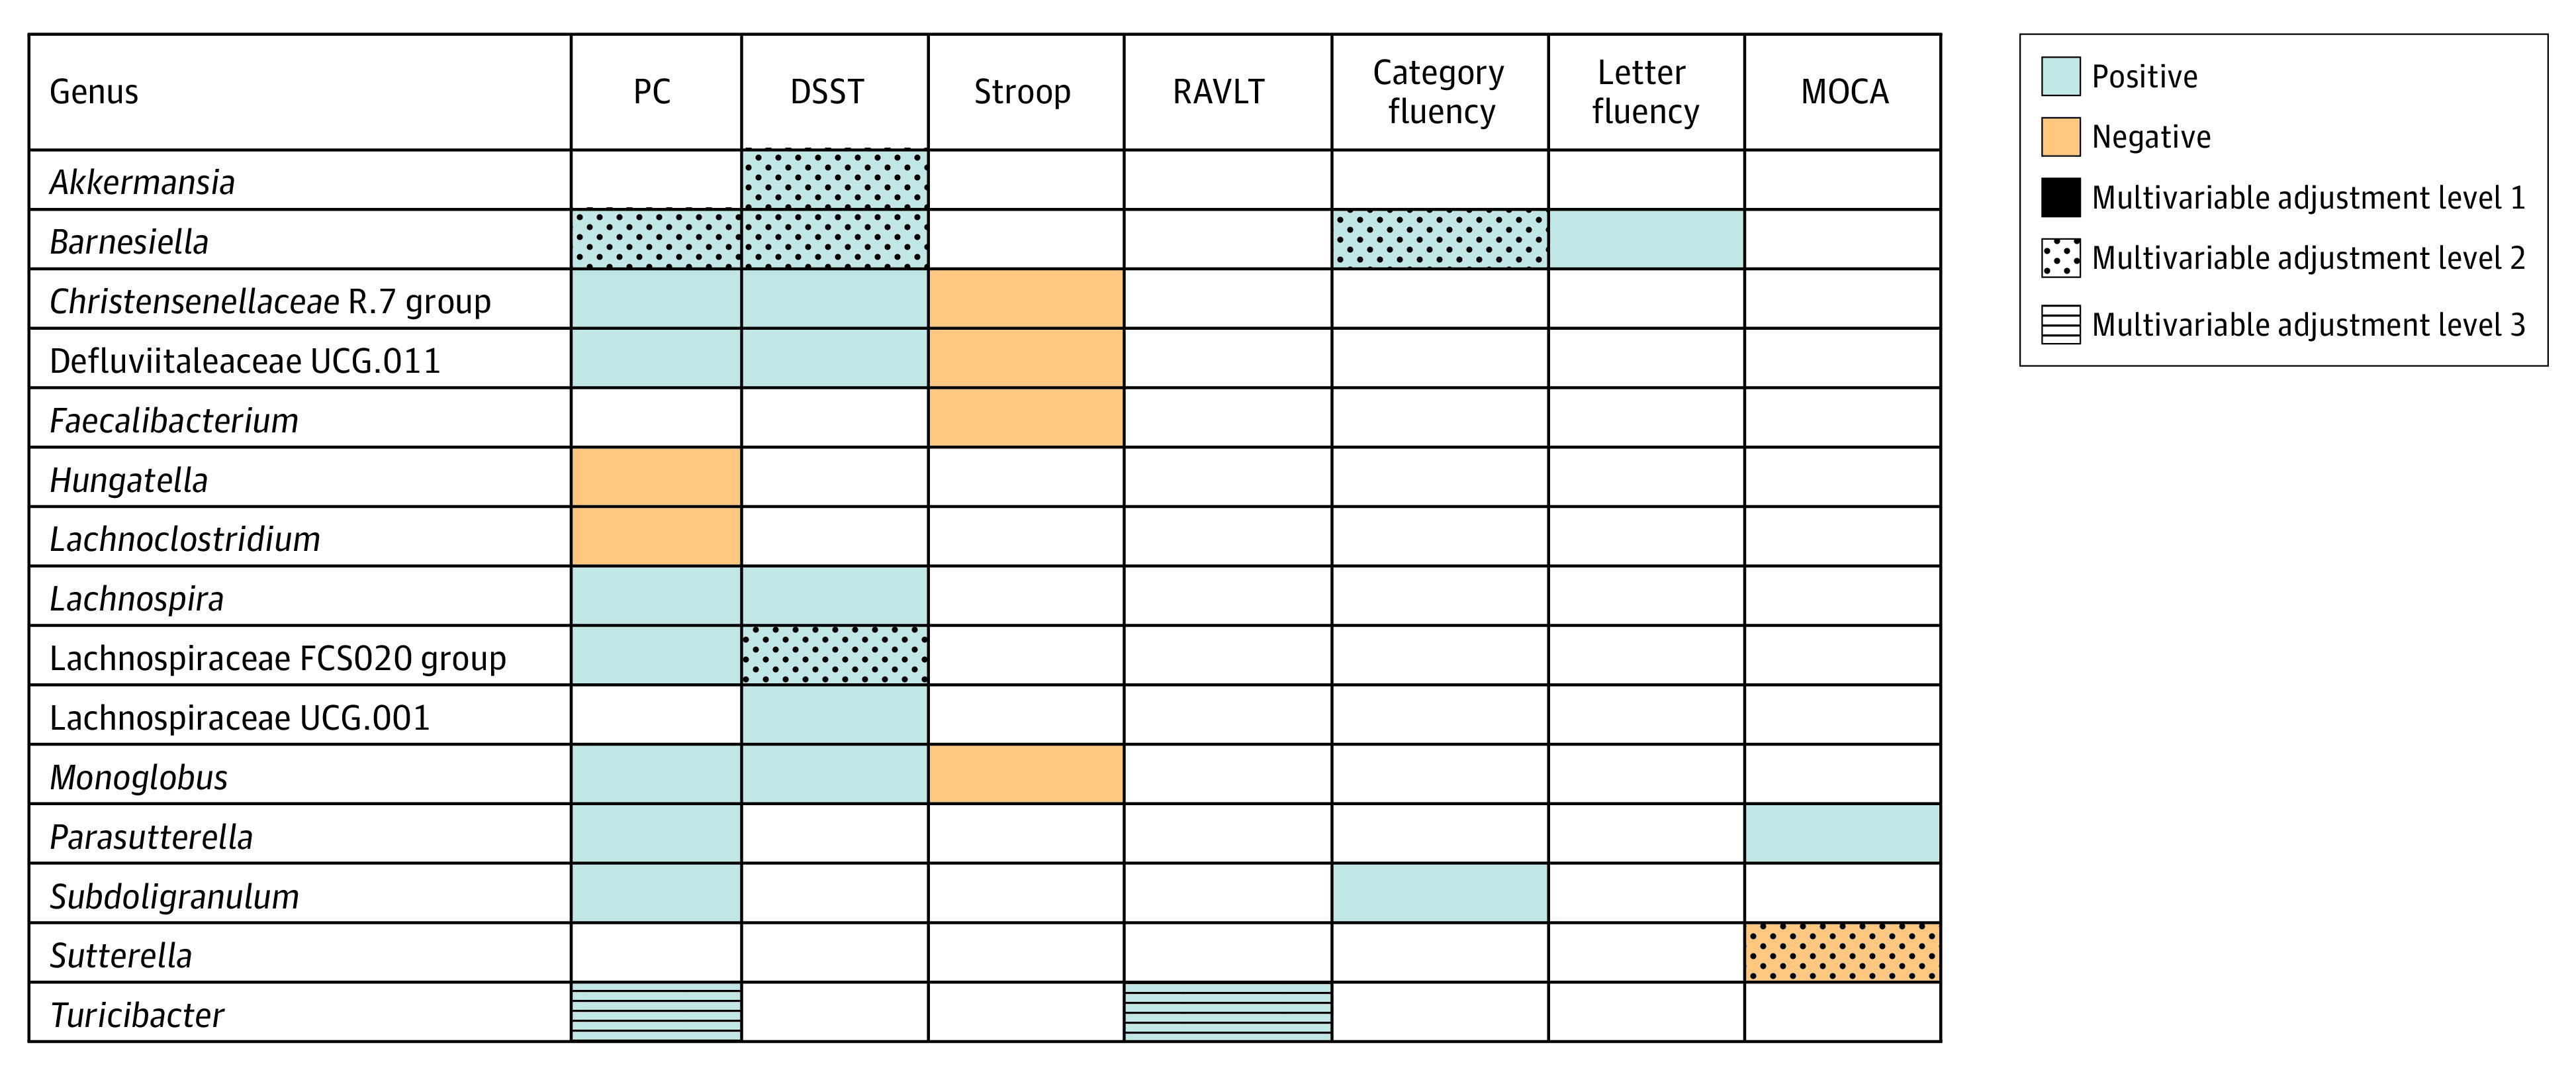
Figure. Multivariable-Adjusted Associations Between Specific Genera and Measures of Cognitive Function.

Genera are restricted to those associated with at least 1 cognitive measure with an FDR-adjusted P < .20. Colors reflect direction of β coefficients (blue indicates positive; orange, negative). Stroop is on its natural scale, with lower values reflecting higher cognitive scores. Patterning indicates the highest level of multivariable adjustment for which results were statistically significant, as follows: solid indicates results were significant after adjustment for sequencing batch, age, race, sex, study center; dotted, results remained significant after additional adjustment for education; horizontal lines, results were significant after further adjustment for physical activity, diet, smoking, medication use, body mass index, diabetes, and hypertension.
