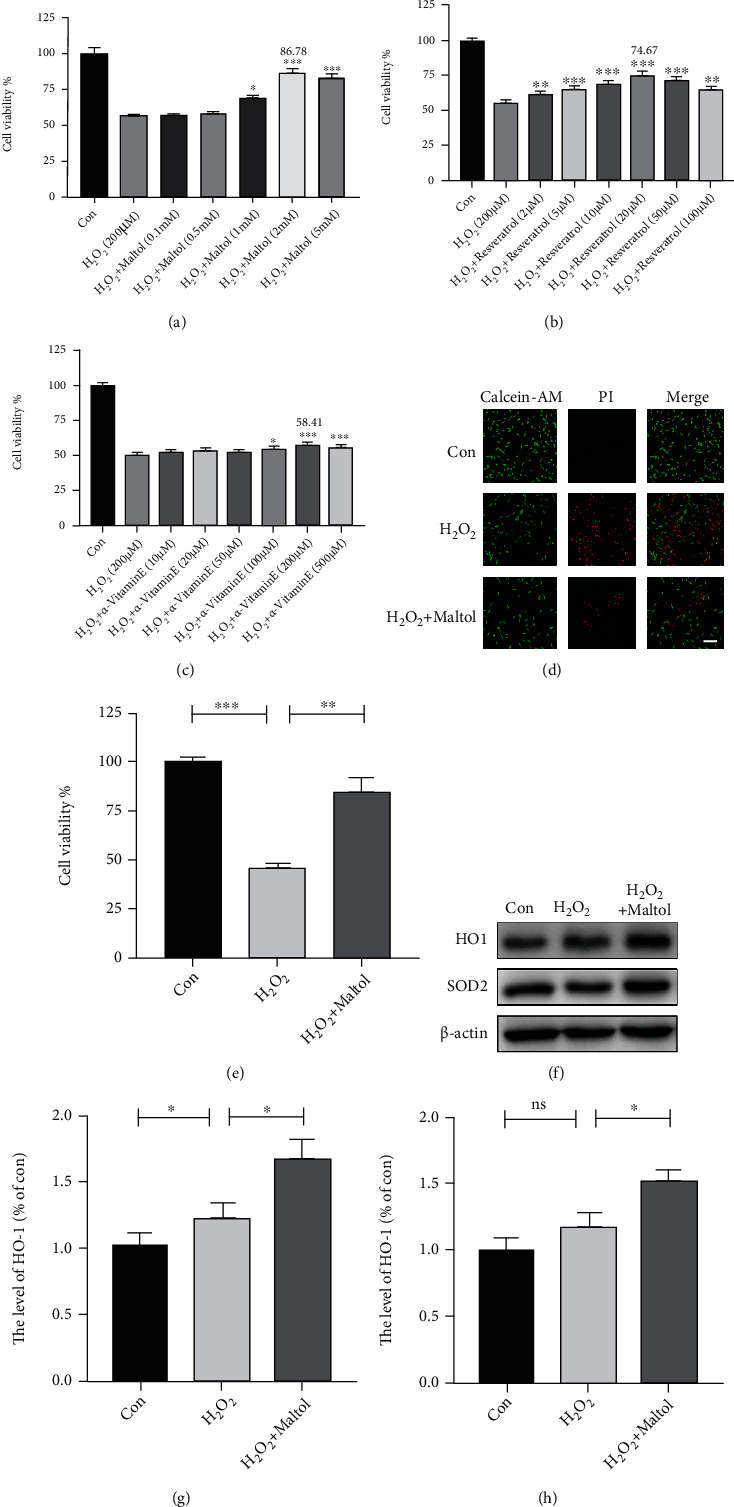
Figure 4.

Maltol attenuated H2O2-induced oxidative stress and apoptosis in PC12 cells. (a–c) Adopting CCK-8 to measure relative cell viability after being treated with maltol, resveratrol, and α-vitamin E in different concentrations. n = 4 per group. ∗P < 0.05, ∗∗P < 0.01, ∗∗∗P < 0.001 vs. H2O2 group. (d–e) Adopting the Calcein-AM/PI Double Stain Kit to distinguish live cells (green) from dead cells (red) and calculate cell viability. Scale bar = 100 μm. (f–h) Western blots analysis of HO-1 and SOD2 in vitro experiments. n = 3 per group. Values were given as means ± SD. ∗P < 0.05, ∗∗P < 0.01, ∗∗∗P < 0.001, and NS (not significant).
