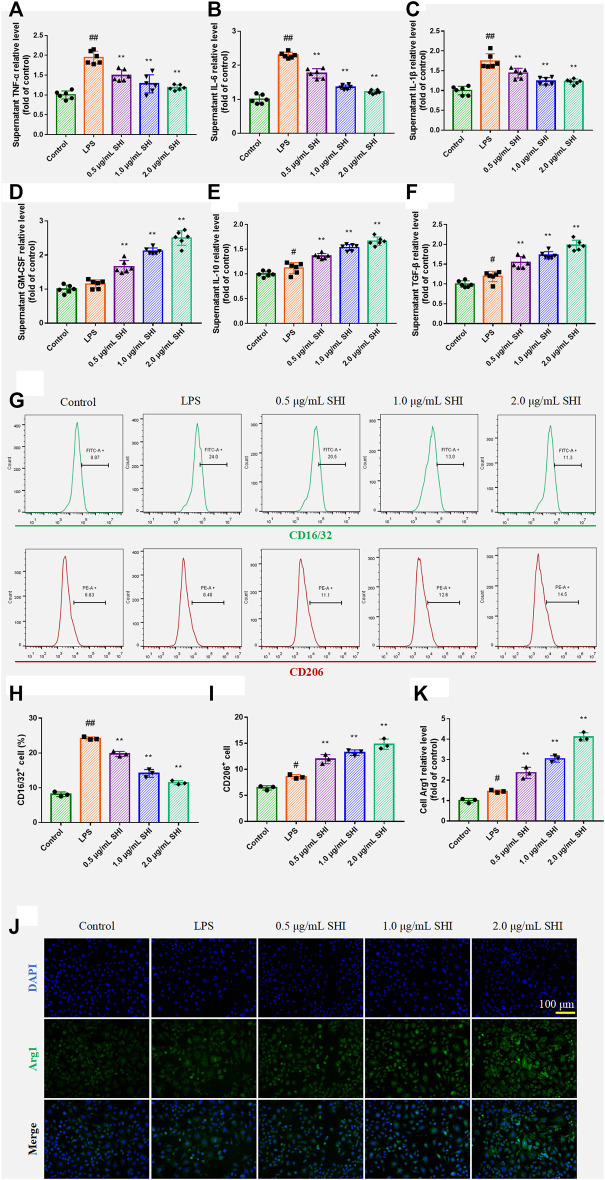
FIGURE 3.
The effect of SHI on macrophage polarization in LPS-induced RAW264.7 cells. The cells were treated with SHI (0.5, 1.0, and 2.0 μg/ml). About 2 h later, the cells were stimulated with LPS (5 μg/ml) for 24 h. The relative levels of (A) TNF-α, (B) IL-6, (C) IL-1β, (D) GM-CSF, (E) IL-10, and (F) TGF-β in the supernatant of LPS-induced RAW264.7 cells. (G–I) The cell count of CD16/32 and CD206. (J,K) The ECM1 expression by immunofluorescence. The data are expressed as mean ± SD. Compared with control: # p < 0.05, ## p < 0.01. Compared with LPS: *p < 0.05, **p < 0.01.

