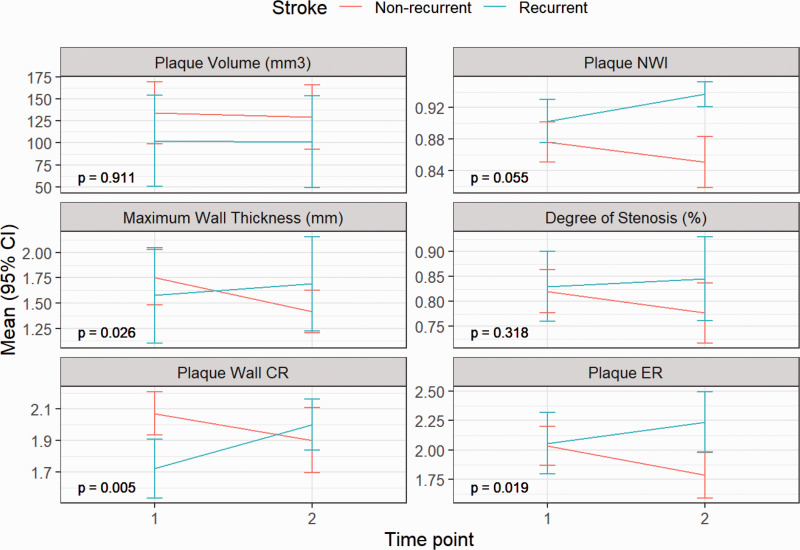
Figure 3.
Quantitative variables are expressed as means ± 1.96 standard error. All plaque features showed a trend towards improvement in the non-recurrent group (n=22) while in the recurrent group (n = 7), most plaque features showed varying degrees of increase over the treatment period. The changes in maximum wall thickness (P = 0.026), plaque-wall contrast ratio (CR) (P = 0.005) and plaque enhancement ratio (ER) (P = 0.019) showed significant differences between the two groups. P values were adjusted for multiple comparisons using the Benjamin and Hochberg correction for false discovery rate. pNWI: peak normalized wall index.

