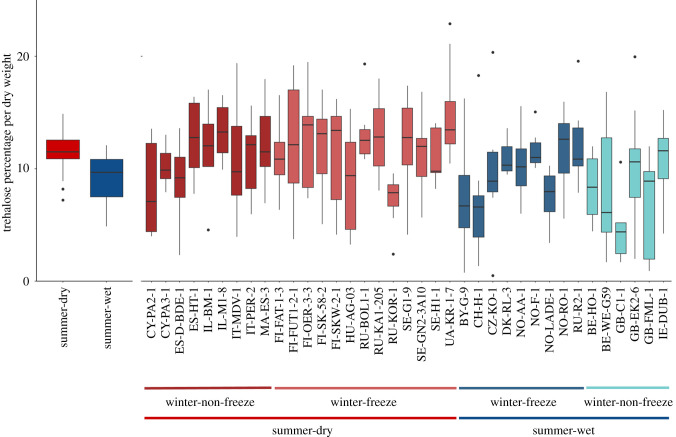
Figure 2.
Average trehalose concentration for summer-dry (red) and summer-wet (blue) separated for habitat types (on the left) and for genotypes (on the right). Trehalose concentration is given as a percentage of dry weight per resting egg. Box plots show median, first and third quartile. Whiskers extend to 1.5 times from the interquartile range upper and lower limits. The dots show data points beyond whiskers.

