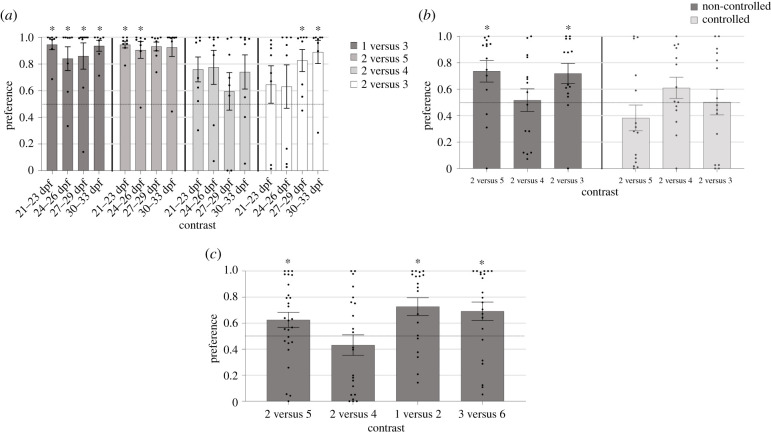
Figure 2.
Investigating quantity discrimination. (a) Ontogeny and limit of discrimination abilities. The fish of all ages showed discrimination of easier contrasts, 1 versus 3 and 2 versus 5 (respectively, 0.3 and 0.25 ratio), whereas a developmental change was observed when the most difficult comparison was presented: 2 versus 3 (0.67 ratio). (b) Controlling for overall group space. Without controlling for overall area (light grey columns), the fish show a significant preference for the larger group in both the 2 versus 5 and 2 versus 3 controls. Controlling for overall area results in absence of preference in all the contrasts. (c) Investigating 1 : 2 ratio. Fish successfully discriminate 2 versus 5, 1 versus 2 and 3 versus 6 but not 2 versus 4. Dashed lines indicate chance level, asterisks indicate significant difference to chance with p < 0.05.

