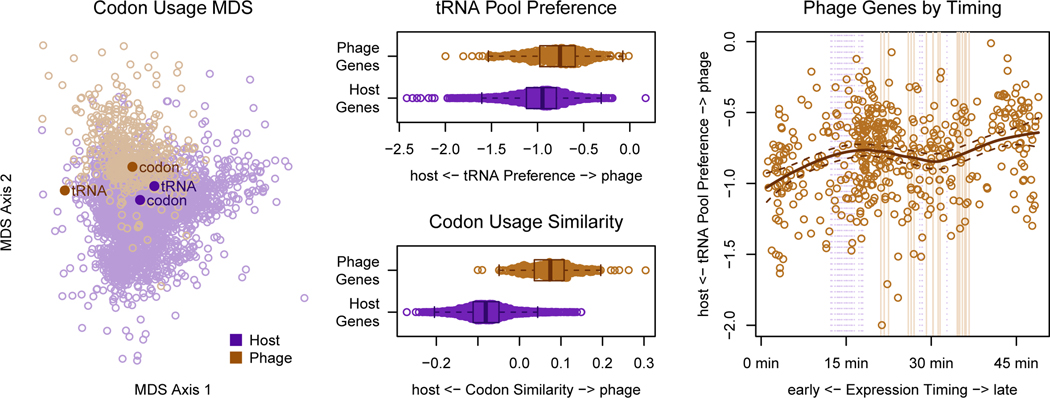
Figure 2. Codon usage bias introduced by the phage tRNA pool is more pronounced in late genes than early genes.
(A) A multidimensional scaling (MDS) plot of phage and host proteins using Shannon-Jensen Divergence of the codon distributions shows that codon usage difference between phage and host. Points representing the codon recognition capacities of the tRNA pool for each organism are overlaid. Points representing the average codon usage for each organism are also overlaid. (B) Preference for the phage tRNA vs. the host tRNA pool (slant). (Zero signifies ambivalence.) (C) Mean codon usage for host and phage. (D) Slant toward the phage tRNA pool vs. timing of expression depicted as center of mass of RNA expression for the first round of infection. Note that this is different from the expression timing described in figure 1. The center of mass in this plot indicates how quickly the RNA transcript is degraded, while the time to half maximum expression shown in figure 1 summarizes transcription timing.

