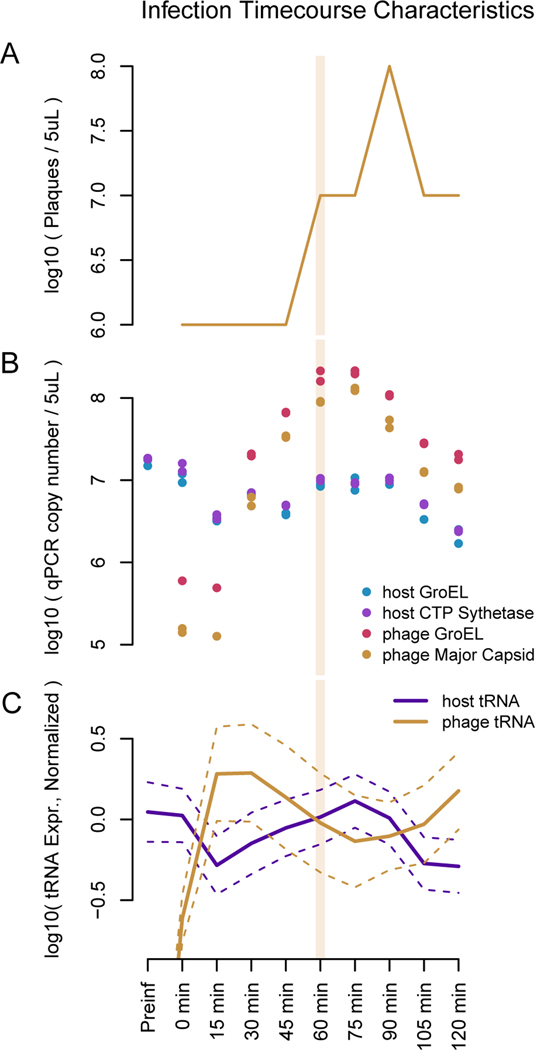
Figure 4. Time course of phage 2.275.O. infection.
Approximately a tenth of the hosts remain uninfected and begin to grow again. A second round of infection starts at approximately 90 minutes. (A) Phage plaques begin to appear 30 minutes into infection, and peak at approximately 90 minutes. (B) qPCR results to quantify bacterial chromosome copies show that the host genome is degraded rapidly upon infection. (C) The tRNA subset of RNA-seq shows that host tRNA, shown in purple, are degraded upon infection while phage tRNA, shown in orange, increase. An average has been taken over all tRNA species, and the errors shown are 1.96*standard dev of the log mean. Reads are normalized to a firefly luciferase spike-in for each sample.

