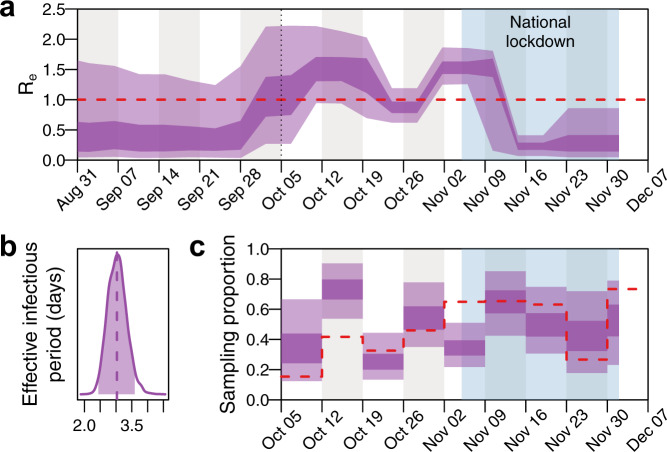
Fig. 5. Effective reproduction number and infectious period of SARS-CoV-2 from a dominant university cluster.
A 20-epoch birth-death skyline model shows the effect of local infection control measures and the national lockdown on the effective reproduction number (Re), and estimates of the mean effective infectious period as 3.03 (95% HPD = 2.44-3.59) days. a Re posterior estimates (dark shading = 50% HPD; light shading = 95% HPD). The dotted line indicates the start of term and the light blue shaded area the 4-week national lockdown in the UK, which was associated with a large fall in COVID-19 cases in University students. The red dashed line indicates Re = 1. b Effective infectious period posterior estimates (shaded region = 95% HPD; dashed line = median). c Weekly sampling proportion posterior estimates (dark shading = 50% HPD; light shading = 95% HPD). The red dashed line indicates the empirical sampling proportion estimates for each week in term (number of sequenced genomes from all University clusters divided by the number of positive tests among University staff and students). Source data are provided as a Source Data file.

