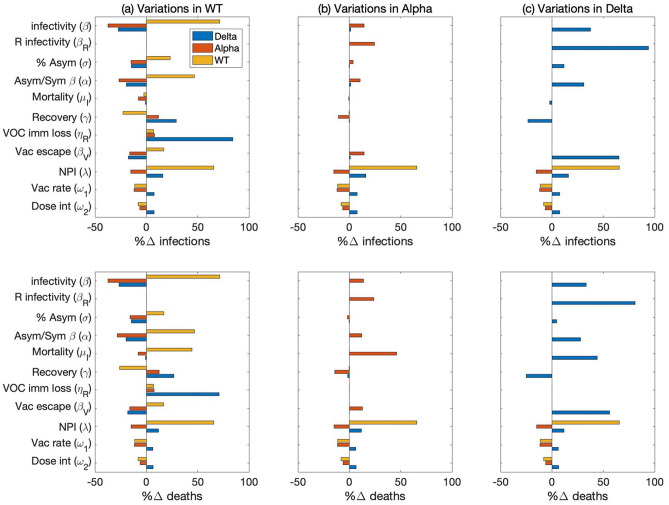
Figure 5.
Sensitivity of model predictions, measured by total infections and deaths, to increases in model parameter values, in a two-year simulation interacting VOC dynamics. Parameters are varied individually for wild-type (column a), Alpha (column b), and Delta (column c). Relative changes in the number of infections and deaths are then computed for wild-type (yellow bars), Alpha (red bars), and Delta (blue bars). Parameter examined include virus infectivity (β), rate of infection of individuals recovered from a different variant (βR), ratio of asymptomatic versus symptomatic infections (σ), degree of increased infectivity β (due to mobility) of asymptomatic infected individuals compared to symptomatic ones, mortality rate of infected individuals (μI), disease recovery rate (γ), rate of loss of immunity due to infection (ηR), vaccine escape rate (βV), NPI stringency (λ), dosing interval (ω2), vaccination rate (ω1).

