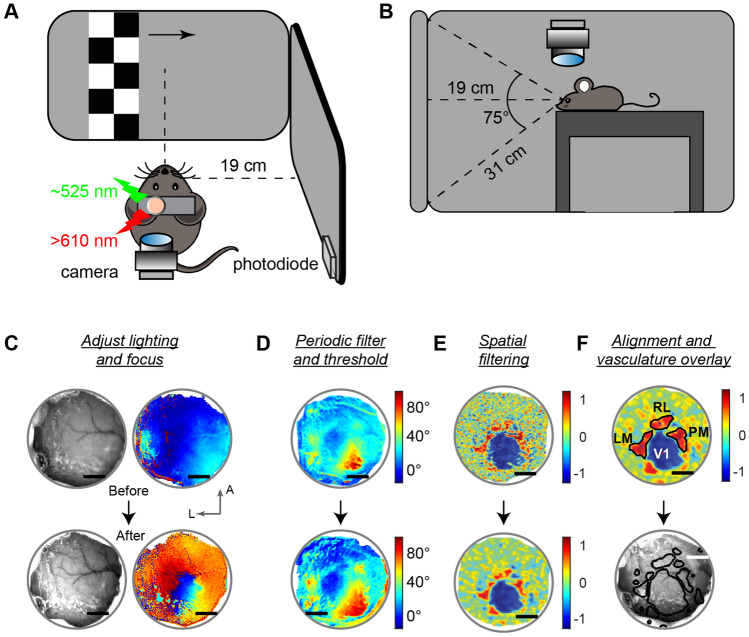
Figure 1.
Experimental setup and optimization steps for transcranial intrinsic signal imaging. (A, B) Position of mouse and monitors displaying visual stimuli. Eyes were vertically and horizontally centered at each monitor (~ 19 cm away from each), and these formed a right angle. A primary computer controlled the main system components: light intensity (Red light: λ = > 610 nm; Green light: λ = ~ 525 nm); a complementary metal–oxide–semiconductor (CMOS) camera coupled to a tandem lens macroscope; and a photodiode recording the timing of visual display events. A secondary computer displays visual stimuli and communicates via UDP with the primary computer. The visual stimulus is a contrast-reversing (6 Hz) checkerboard pattern drifting across the screen (0.055 Hz). Stimuli drifted from left to right (and right to left) to map retinotopy in azimuth and drifted from bottom to top (and top to bottom) to map elevation. (C) Experiments start with a coarse test for hemodynamic signals under green light (see Table 1, “Methods” section), then move to acquisition with red light. If green light imaging failed to generate high quality signals (top, before), the illumination and focal plane was adjusted (bottom). Color scale shows normalized signal intensity and does not correspond to visual space. Scale bar = 1 mm. (D) After signal optimization, red light imaging commences. Algorithms exclude noisy frames based on a minimum signal to noise (SNR) threshold for periodic responses at the stimulus frequency (see “Methods” section), resulting in higher quality maps (bottom). Resulting absolute phase maps are shown (− 10° to 120° in azimuth). (E) Optimal spatial filtering of high SNR frames defines clear areal boundaries in visual field sign maps (see Fig. 2C and Fig. S4C–F). Visual field sign (VFS) maps shown, scale from − 1 (sign negative areas) to 1 (sign positive areas). (F) Retinotopic maps, VFS maps and area contours (top) are aligned to vasculature images (bottom, acquired with green light) for registration of areas with visible vasculature landmarks. Investigators assess alignment, coverage range, size, and location of areas relative to expected6. See also Table 2. (C–F) All in same mouse (Mouse 1; Fig. S3).

