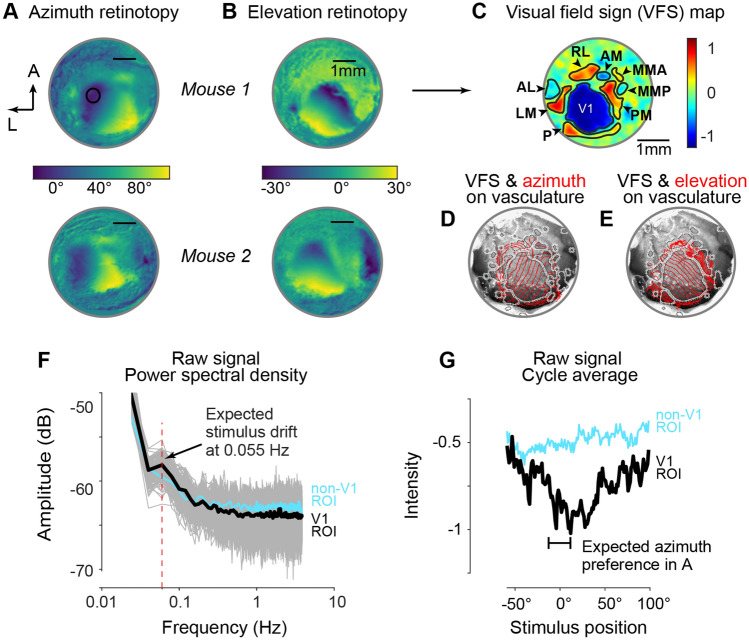
Figure 2.
Retinotopic maps of azimuth, elevation, and visual field sign with intact skull ISI. (A) Retinotopic maps in azimuth from 2 mice (Mouse 1 and 2; see Fig. S3) with 5-mm intact skull cranial windows. Colorbar shows spatial location of visual stimulus driving maximal Fourier response at each image pixel (see “Methods” section). Scale bar is 1 mm. (B) As in (A), for elevation maps in same mice. (C) Visual field sign (VFS) map for mouse 1 showing cortical area boundaries, computed from azimuth and elevation maps. Scale is − 1 to 1 (see “Methods” section for calculation). Identified areas V1 (primary visual cortex), Area P (posterior aspect of visual cortex), LM (lateromedial), AL (anterolateral), RL (rostrolateral), AM (anteriomedial), PM (posteromedial), MMA (Medio-medial-anterior), and MMP (Medio-medial-posterior). Identified areas correspond to prior reports with excised skull cranial windows6. (D) Overlay of VFS (white) and azimuth (red) retinotopic map contours (10° increments) on image of vasculature of Mouse 1. Custom processing in finalized software package allows users to define visual areas from VFS map, and automatically align maps to vasculature. (E) As (D), for elevation map contours. (F) Power spectrum of raw reflectance from multiple pixels (black circle in A) across 2880 imaging frames and 16 stimulus trials (grey traces). A peak is present in the average response (black) at the frequency of visual stimulus (0.055 Hz, red dashed line). Blue trace shows power spectrum of pixels in adjacent non-visual cortical area from same trials. (G) Average intensity versus stimulus position averaged across 200 stimulus cycles. Maximum intensity change (decreased reflectance) occurs near preferred stimulus location expected from azimuth map (black circle in A). Maximum slightly displaced due to hemodynamic delay for stimulus drifting from negative to positive azimuth (Fig. 1A). Blue trace shows cycle average for pixels outside of visual areas.

