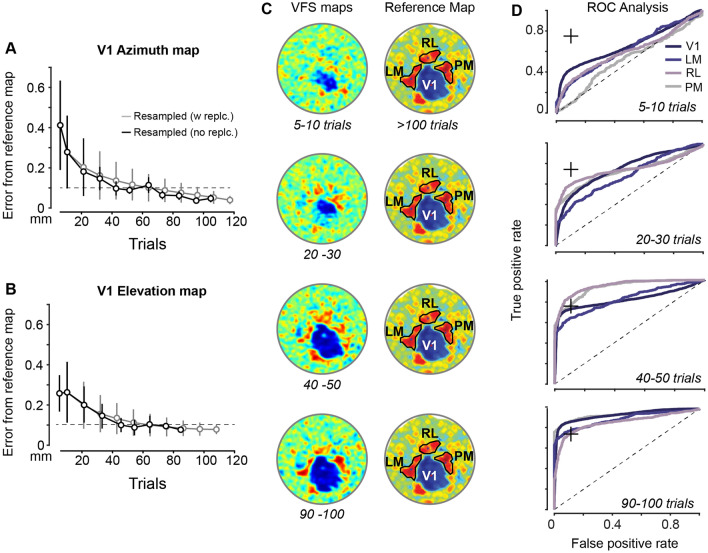
Figure 3.
Quantifying resolvability of V1 and HVAs as a function of trials. (A) Error of estimated azimuth receptive field (RF) locations in V1 as a function of number of trials. Retinotopic contour maps computed from varying trial numbers (abscissa), and error estimated as Euclidean distance of RF locations in trial-limited maps versus reference map (mean distance ± SD; centroids of contours binned at 10°, Fig. 2D). Reference map computed from 190 trials (5 recording sessions), trial-limited maps computed by randomly subsampling from these 190 trials with (grey) or without (black) replacement. Error in estimated RF locations falls < 0.1 mm (dashed line) within 60 trials. No significant difference in centroids of azimuth contours for reference maps and resampled maps with > 60 trials (see Results). (B) Same mouse as (A), for elevation RFs. Reference maps from 170 trials (5 recording sessions). No significant difference in centroids of elevation contours (e.g., Fig. 2E) between reference maps and resampled maps with > 60 trials (p = 0.325, Mann–Whitney U with Bonferroni correction). (C) Trial limited VFS maps (left) versus reference VFS map (right). Same sessions as (A,B). Reference map shows contours for V1 and only 3 HVAs for clarity: LM (lateromedial area), RL (rostrolateral), and PM (posteromedial). (D) Receiver operating characteristic (ROC) curves computed for centroid detection of V1 and 3 sign positive HVAs (LM, RL, PM) for same trial limited VFS maps in (C). True positives evaluated as average pixel values in areal contours defined from reference VFS maps versus noise areas outside of visual cortex (Fig. S2). Areal boundaries for V1, RL, and PM pass detection threshold (75% accuracy, + symbol) after > 50 visual stimulus trials. LM areal boundaries pass threshold after > 70 trials. Sign negative areas AL and AM were also readily identified with > 70 trials (e.g., Fig. 2C). (A–D) All from Mouse 1 (Fig. S3).

