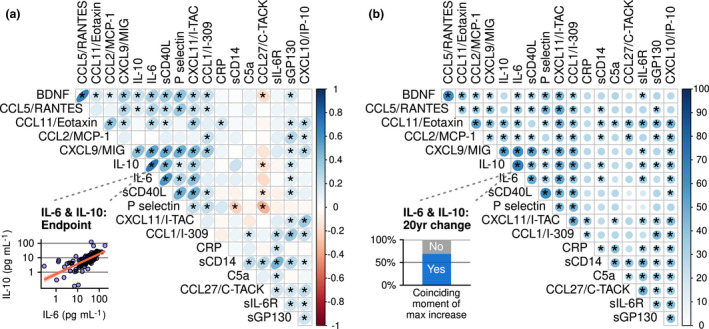
Figure 3.

Relationships between inflammatory markers shown: (a) correlations between pairs of inflammatory markers at the study endpoint; and (b) similarities between pairs of inflammatory marker trajectories during the approximately 20 years of follow‐up. In (a), direction and strength of the association are visualised by ellipses of different eccentricities and a colour gradient. The inset shows the correlation between one pair of biomarkers (IL‐6 and IL‐10) as an example. In (b), the blue colour gradient and the size of the circles encode the percentage of participants in whom a pair of biomarkers peaked in concentration at the same time interval during follow‐up. For the pair of biomarkers IL‐6 and IL‐10, this was seen in 69% of the participants (see inset). * = existence of an association between two inflammatory markers is confirmed, based on a false discovery rate of 15%. n = 144.
