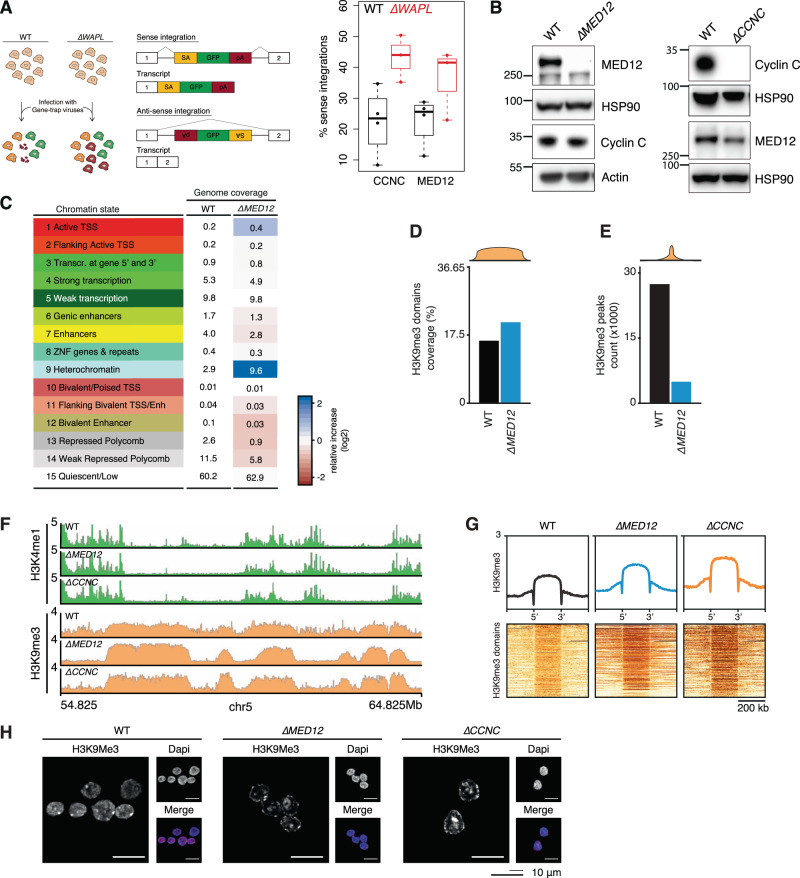
Fig. 2. Mediator-CDK subunits restrict heterochromatin.
A Left panel shows schematic explanation of the haploid genetic gene trap assay. Sense integrations with respect to a protein coding gene result in truncating deletion. Anti-sense integrations are largely inconsequential and serve as a control for accessibility of the gene. Right panel shows percentage of sense integrations (over a total of sense and anti-sense) shown for WT and ∆WAPL cells for the Mediator subunits Cyclin-C (CCNC) and MED12. Boxplot shows the result of n = 3 haploid genetic gene trap assays for WT and ∆WAPL cells. Boxes indicate the interquartile range (IQR) of the data (25–75%) and box center line indicates the median. Whiskers extend to the minimum or maximum value that lies no further than 1.5 times the IQR from the bottom or top of the box, respectively. B Western blot analysis confirming knock-out of MED12 and Cyclin-C. HSP90 and actin represent loading controls for MED12 and Cyclin-C panels directly above. Representative images are shown from experiments that have been performed twice. C ChromHMM analysis segmenting the genome in 15 chromatin states shown for WT and MED12 cells. Table shows the percentage of genome coverage. Red/blue color scale indicates the relative increase or decrease in ∆MED12 compared to the WT cells. D Barplot showing the coverage of H3K9me3 domains over the genome and (E) the absolute number of H3K9me3 peaks. F Example region showing the H3K4me1 (green) and H3K9me3 (orange) ChIPseq profiles in WT, ∆MED12 and ∆CCNC cells. G Aggregate plots showing the average H3K9me3 signal over all the H3K9me3 domains for WT and mutant cells. Heatmaps show the signal in and around individual domains. H Immunofluorescence analysis of H3K9me3 levels in WT, ∆MED12 and ∆CCNC cells. Representative images are shown from experiments that have been performed twice (see Supplementary Fig. 2e).

