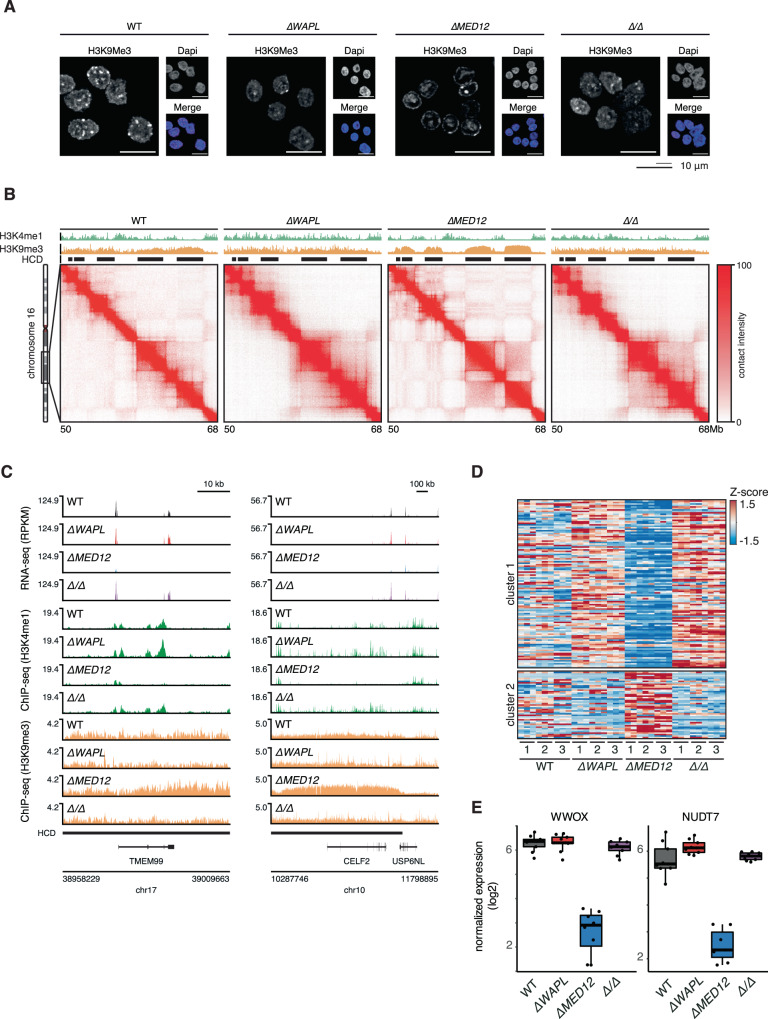
Fig. 5. MED12 maintains a transcription-permissible 3D genome organization.
A Immunofluorescence analysis of H3K9me3 levels in WT, ∆WAPL, ∆MED12 and ∆WAPL/∆MED12 (∆/∆) cells. Representative images are shown from experiments that have been performed twice (see Supplementary Fig. 5b). B ICE normalized Hi-C contact matrix at 20 kb resolution for WT, ∆MED12, ∆WAPL and ∆WAPL/∆MED12 cells are shown for a region on chromosome 16. Contact matrices are visualized using GENOVA. Black rectangles indicate the position of HCDs. C RNA-seq and ChIP-seq profiles of TMEM99 (left) and CELF2 (right) in WT, ∆MED12, ∆WAPL and ∆WAPL/∆MED12 cells. Triplicate datasets are overlayed per cell line. D RNAseq heatmap showing expression of genes in H3K9me3 domains. K-means clustering (k = 2) reveals a cluster of silenced genes in H3K9me3. E Boxplots show expression of two example genes on chromosome 16. Boxplots show the expression levels in the RNAseq experiments (n = 9) for all assayed genotypes. Boxes indicate the interquartile range (IQR) of the data (25–75%) and box center line indicates the median. Whiskers extend to the minimum or maximum value that lies no further than 1.5 times the IQR from the bottom or top of the box.

