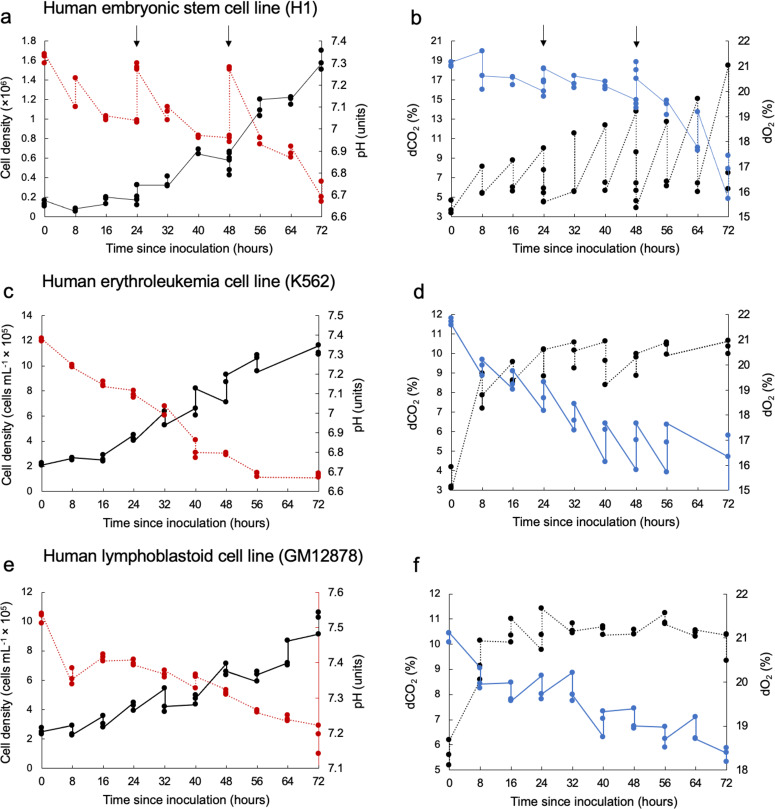
Fig. 2. Measured environmental conditions in human cell cultures.
a Time course of cell density (black data points) and medium pH (red data points) in cultures of human embryonic stem cells (H1 hESC, seeding density 1.8 × 10⁵ in T25 flasks with a growth area of 25 cm2 and working volume of 5 mL). b Time course of dCO2 (black data points) and dO2 (blue data points) in cultures of H1 hESC. Medium buffered with 5% CO2/22 mM HCO3− plus 15 mM HEPES. Arrows in panels (a) and (b) represent the timing of 24 h medium exchanges for the H1 hESC cell line. c Time course of cell density (black data points) and medium pH (red data points) in cultures of human erythroleukemia cells (K562, seeding density 2.0 × 10⁵ mL−1 in T75 flasks with a growth area of 75cm2 and working volume of 20 mL). d Time course of dCO2 (black data points) and dO2 (blue data points) in cultures of K562. Medium buffered with 5% CO2/22 mM HCO3−. e Time course of cell density (black data points) and medium pH (red data points) in cultures of human lymphoblastoid cells (GM12878, seeding density 2.0 × 10⁵ mL−1 in T75 flasks with a growth area of 75 cm2 and working volume of 20 mL). f Time course of dCO2 (black data points) and dO2 (blue data points) in cultures of GM12878. Medium buffered with 5% CO2/22 mM HCO3−. Measurements conducted for three culture flasks per cell line (three biological replicates each). Data points at each time point represent data for the three biological replicates.

