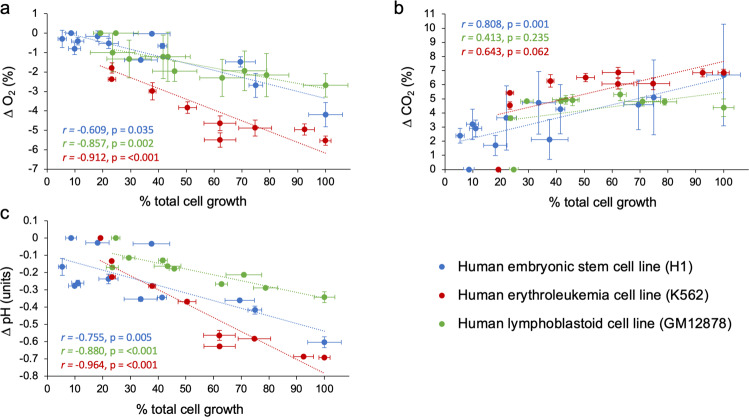
Fig. 4. A comparison of relationships between changes in environmental parameters and cell growth in cultures of H1 hESC, K562, and GM12878.
Delta (∆) values for (a) dO2, (b) dCO2, and (c) pH represent the mean difference between levels measured at 8 h intervals minus measurements taken at time zero. Percent cell growth was calculated based on the assumption that cell densities at 72 h represent 100% cell growth and used to facilitate comparison among the cell line cultures despite differences in cell density units. Data points represent mean values across the three replicate flasks ±1 standard error for each cell line. Insets show the Pearson correlation coefficient (r) and p-value for each correlation model (cf. Supplementary Table S1 for full statistical results).

