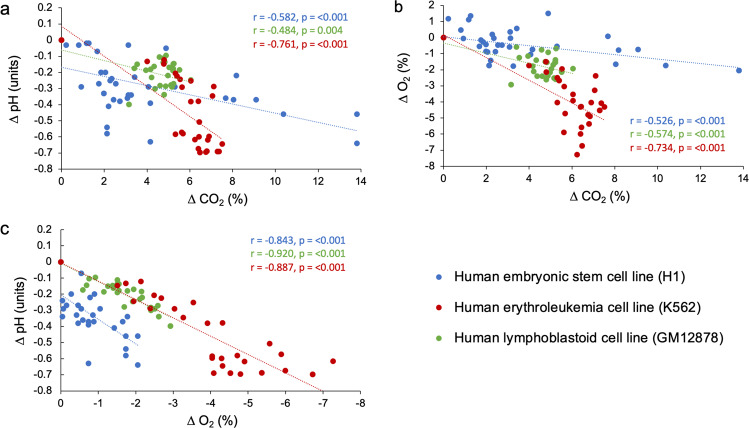
Fig. 5. Relationships between changes in dissolved gases and medium acidification in cultures of H1 hESC, K562, and GM12878.
Delta (∆) values for the environmental variables (pH, dO2, and dCO2) represent the mean difference between levels measured at 8 h intervals minus measurements taken at time zero. a The relationship between reductions in pH and increases in dCO2 in cell culture media. b The relationship between reductions in dO2 and increases in dCO2 in cell culture media. c The relationship between reductions in pH and dO2 in cell culture media. Data points represent individual measurements taken from three culture flasks per cell line. Insets show the Pearson correlation coefficient (r) and p-value for each correlation model (cf. Supplementary Table S2 for full statistical results).

