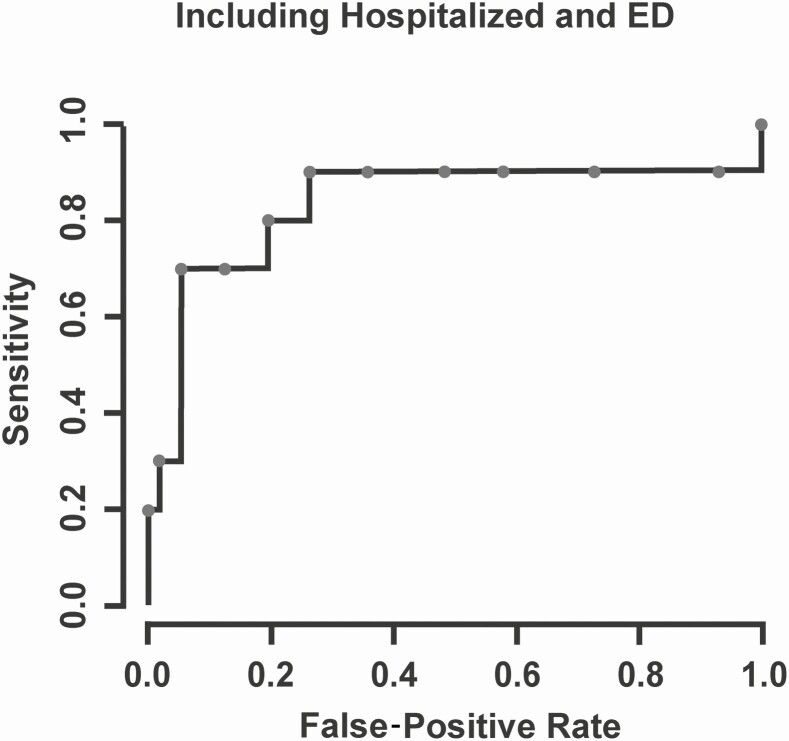
Figure 3.
Receiver operating characteristic curve characterizing the false-positive rate (1–specificity) and sensitivity for classifying intensive care unit (ICU) admission across various cut-points for the severity threshold. The area under the curve is estimated to be 0.849 (95% confidence interval, .629–.977), signifying strong evidence in favor of the severity score’s predictive ability for ICU admission. Abbreviation: ED, emergency department.

