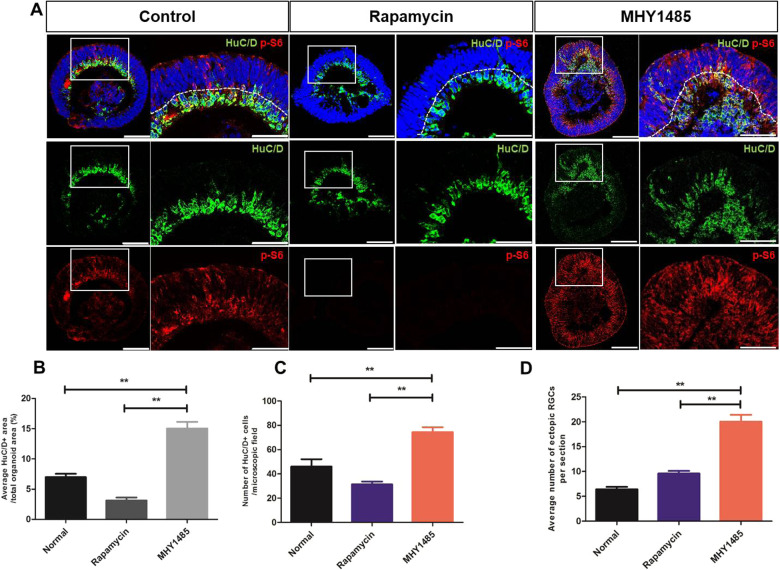
Fig. 5. RGC development and retinal lamination within ROs at 40 days of differentiation after rapamycin or MHY1485 treatment.
A RGC development in control, rapamycin-treated, and MHY1485-treated ROs shown by immunostaining of HuC/D (green) and p-S6 (red) at 40 days of differentiation. B–D Quantification of the ratio of average HuC/D+ area, number of HuC/D positive cells, and number of ectopic RGCs in control, rapamycin-treated, and MHY1485-treated ROs. Data are expressed by mean ± S.E.M. **p < 0.01, by the Kruskal–Wallis test with post hoc analysis. Scale bar in RO whole-image: 100 μm, scale bar in RO magnified image: 50 μm.

