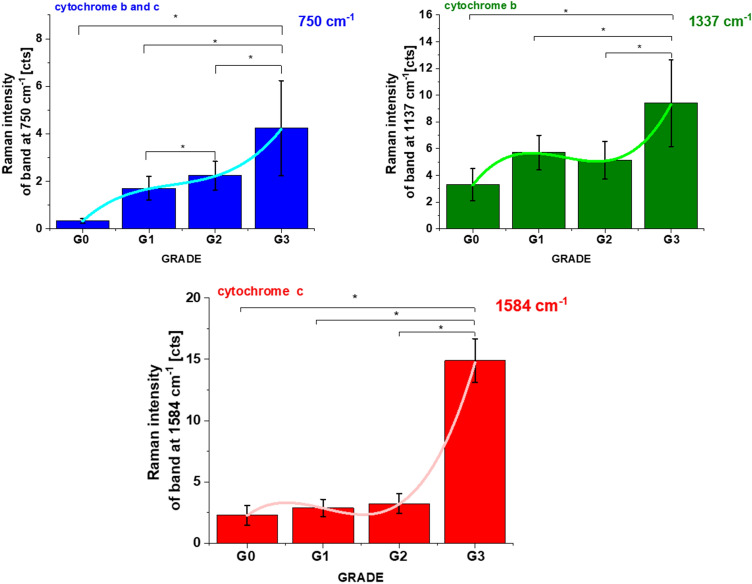
Figure 3.
The Raman intensities I750, I1337, I1584 of Cyt c and Cyt b bands in human breast tissues as a function of breast cancer grade malignancy G0-G3 at excitation 532 nm, average ± SD, the statistically significant result have been marked with asterisk. The one-way ANOVA using the Tukey test was used to calculate the value significance, asterisk * denotes that the differences are statistically significant, p-values ≤ 0.05 were accepted as statistically significant.

