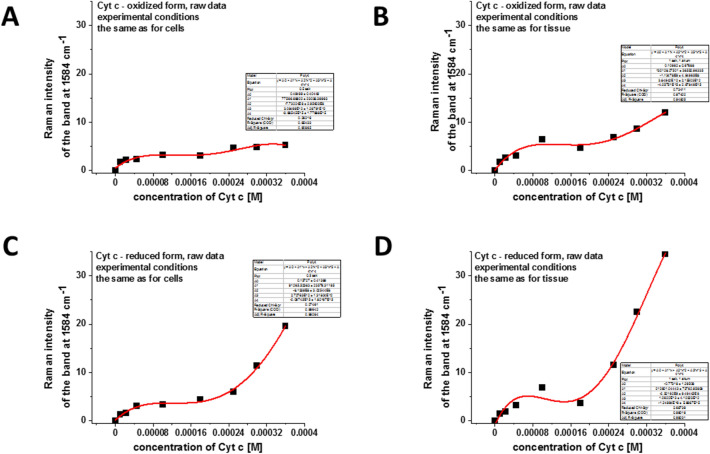
Figure 4.
The intensity of Raman peak centered at 1584 cm−1 as a function of Cyt c concentration (raw data) for: (A) the oxidized form of Cyt c, experimental conditions the same as for breast single cells measurements: integration time 0.5 s, 1 accumulation, laser power 10 mW; (B) the oxidized form of Cyt c, experimental conditions the same as for breast tissue measurements: integration time 1.0 s, 1 accumulation, laser power 10 mW; (C) the reduced form of Cyt c, experimental conditions the same as for breast single cells measurements: integration time 0.5 s, 1 accumulation, laser power 10 mW, reduction agent NaBH4 in tenfold excess; (D) the reduced form of Cyt c, experimental conditions the same as for breast tissue measurements: integration time 1.0 s, 1 accumulation, laser power 10 mW, reduction agent NaBH4 in tenfold excess.

