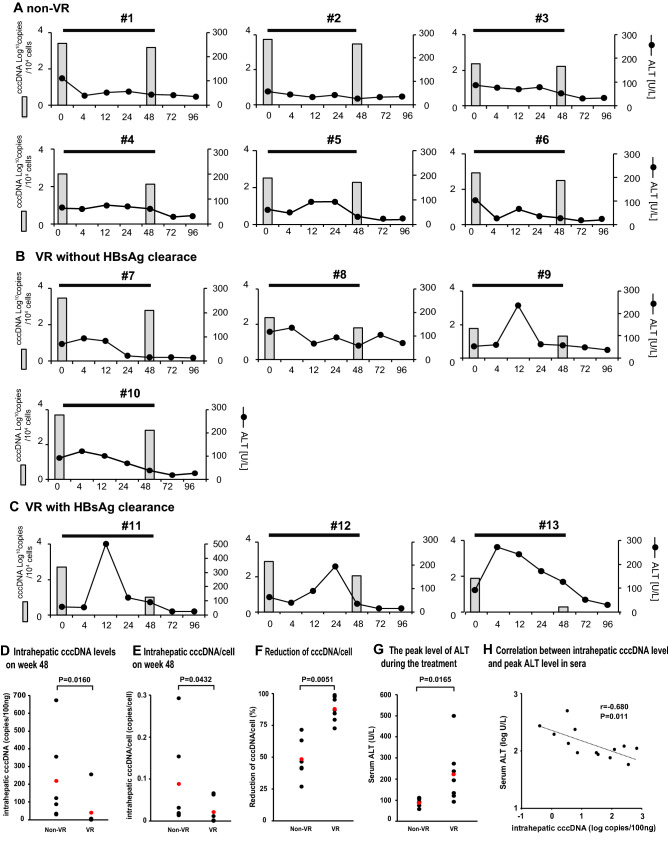
Figure 5.
Changes of intrahepatic cccDNA content and serum ALT in CHB patients with HBV infection by PEG-IFN treatment. Effect of PEG-IFN treatment on intrahepatic cccDNA/104 cells and serum ALT in CHB patients with (A) non-VR, (B) VR without HBsAg clearance and (C) VR with HBsAg clearance, during and after PEG-IFN treatment. These patients were treated with PEG-IFN monotherapy (180 µg/week) for 48 weeks and then followed for another 48 weeks after PEG-IFN withdrawal. (D) Each dot represents the average of duplicate tests for the copy number of intrahepatic cccDNA level in 100 ng total DNA of each patient. The Mann–Whitney U-test was used to examine statistical difference between the two groups. The mean values of the two groups were depicted by red dots, and were 217.7 (30.7–674.0) in the non-VR group and 39.8 (0.4–256.8) in the VR group. (E) Each dot represents the average of duplicate tests for the copy number of cccDNA per hepatocyte of each patient. The Mann–Whitney U-test was used to examine the statistical difference between the two groups. The mean values of the two groups were depicted by red dots, and were 0.088 (0.013–0.293) in the non-VR and 0.0206 (0.0002–0.0659) in the VR groups. (F) The reduction of cccDNA/cell (%) from baseline to the end of treatment was calculated in each patient, and the statistical difference was determined by the Mann–Whitney U-test. Red dots depict the mean values in the two group. (G) The peak levels of ALT during PEG-IFN treatment were 88.5 (58–111) in the non-VR and 222.0 (93–500) in the VR group. Comparison between two groups was performed by the Mann–Whitney U test. (H) Negative correlation between intrahepatic cccDNA at week 48 and the peak levels of ALT in CHB patients. The correlation between variables was analyzed using Spearman's rank correlation coefficient.

