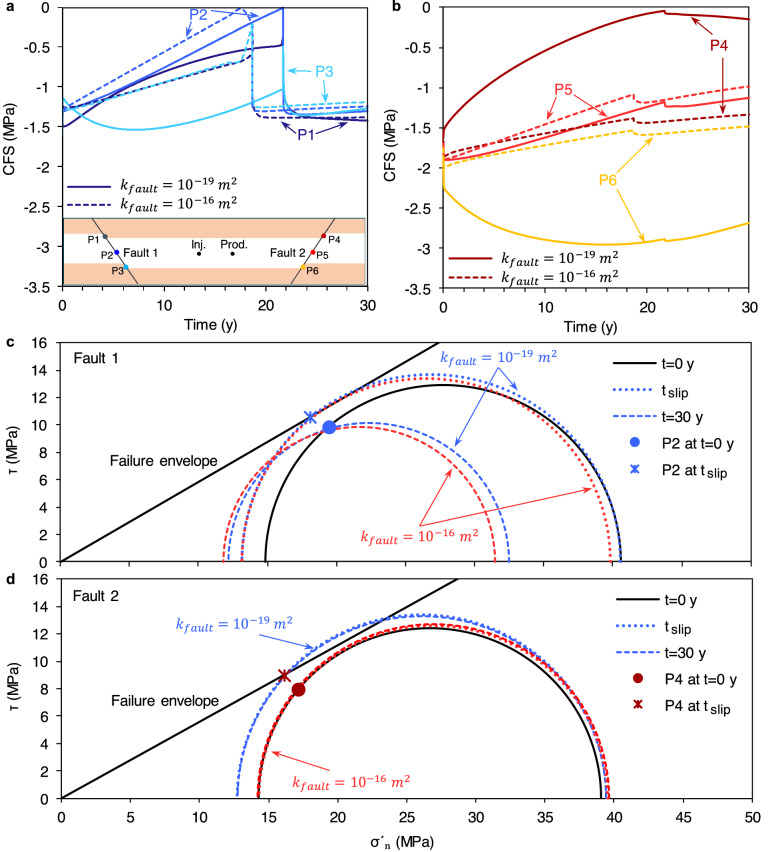
Figure 6.
Impact of fault permeability on its stability. Evolution with time of the slip tendency (CFS) at the top, middle and bottom of fault 1 (a, corresponding to dark to light blue, respectively) and fault 2 (b, corresponding to brown, red and orange, respectively). The most critical stability conditions are reached in the middle of fault 1 (point 2) and at the top of fault 2 (point 4). (c,d) Mohr circles are drawn at these two points before circulation (t = 0), and after tslip ( 18 and 21 years for high- and low- permeability faults, respectively) and t = 30 years of water circulation. One should note that minor stress changes on fault 2 occur after the slip; thus, Mohr circles of tslip and t = 30 years almost coincide.

