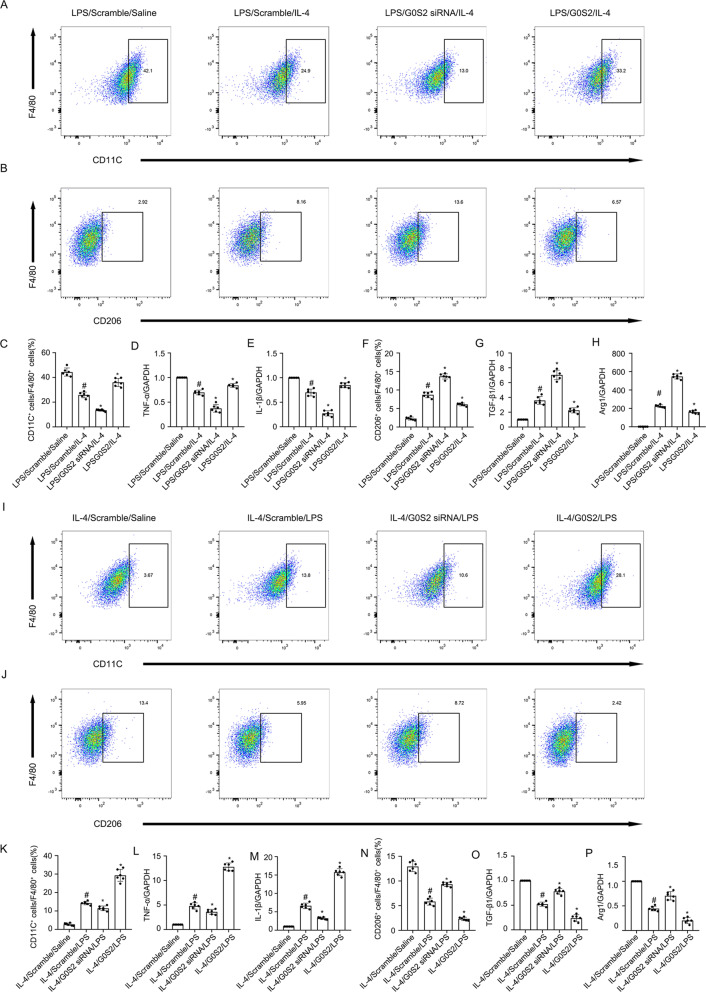
Fig. 6. G0S2 promoted transition of M2 to M1.
RAW264.7 macrophage cells were transfected with G0S2 siRNA or G0S2 plasmid plus with LPS 1 μg/ml or IL-4 20 ng/ml treatment for 24 h. A, C, I, and K Representative FCM analysis the ration of M1 (CD11C+ cells vs. F4/80 cells). B, F, J, and N Representative FCM analysis the ration of M2 (CD206+ cells vs. F4/80 cells). D and L The expression levels of TNF-α were detected by real-time qPCR. E and M The expression levels of IL-1β were detected by real-time qPCR. G and O The expression levels of TGF-β1 were detected by real-time qPCR. H and P The expression levels of Arg1 were detected by real-time qPCR. #P < 0.05 versus Scramble plus LPS or IL-4 group. Data are expressed as means ± sd (n = 6). *P < 0.05 versus LPS and IL-4 group.

