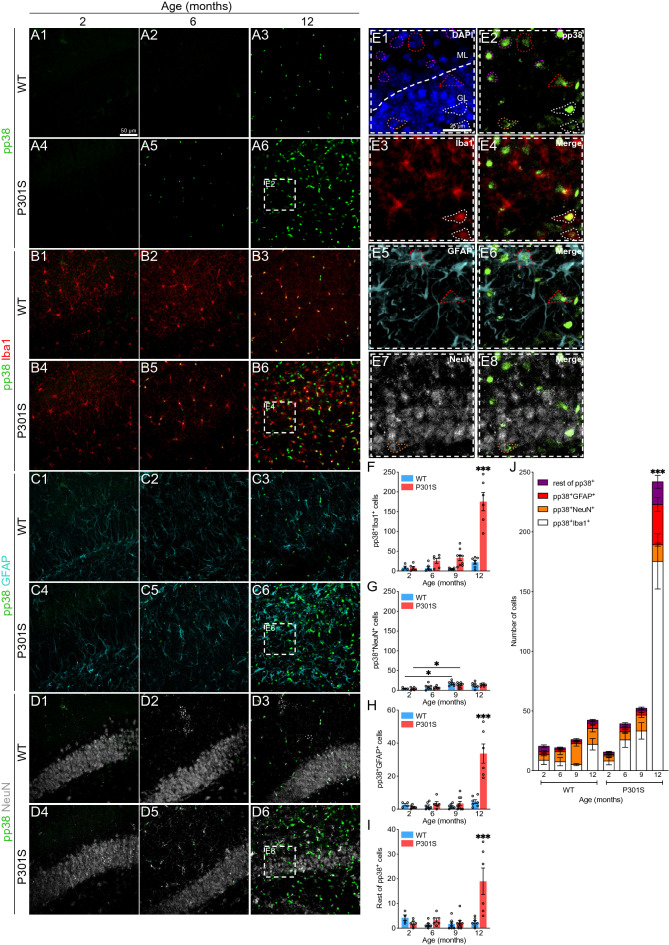
Figure 2.
Analysis of p38 activation in the hippocampus of the P301S mouse. (A-D) Representative images showing p38 activation (pp38. Green), microglia (Iba1. Red), astrocytes (GFAP. Cyan) and neurons (NeuN. White) in the hippocampus of WT and P301S animals from 2 to 12 months of age. White dashed boxes correspond to the amplified section (E). Dashed forms indicate pp38 colocalization with the different cell markers: pp38+Iba1+ (white), pp38+GFAP+ (red), pp38+NeuN+ (orange) and pp38+Iba−GFAP−NeuN− (purple). Nuclei were labeled with DAPI (blue). Number of pp38+ cells in microglia (F), neurons (G), astrocytes (H) and remaining cells (I). (J) Representation of all cell populations together. n = 57 (6–9 mice per group). Graphs show mean ± SEM. *p < 0.05; ***p < 0.001 from two-way ANOVA. Scale bars: 50 µm (A1) and 25 µm (E1). GL: granular layer, ML: molecular layer.

