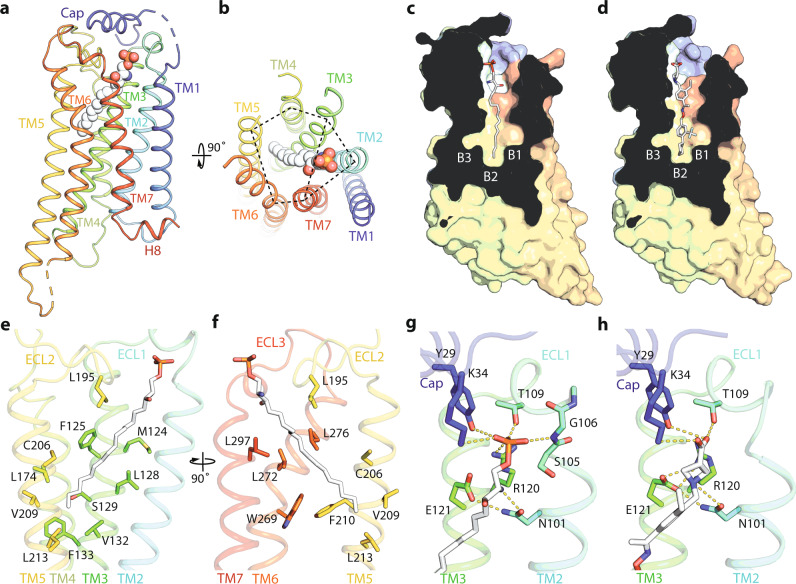
Fig. 2. Interactions between S1P or Siponimod and S1P1.
a, b Cartoon representation of S1P1 with the bound S1P in spheres, and rotated 90° to show the two binding modules of transmembrane (TM) helices indicated by dashed lines. c, d Slice through views of the ligand-binding pockets of S1P1 with the side binding pockets B1, B2 and B3 indicated. e, h Residues involved in interacting with the hydrocarbon chain (e–h) or the polar head group (g, h) of S1P or Siponimod are shown in sticks.

