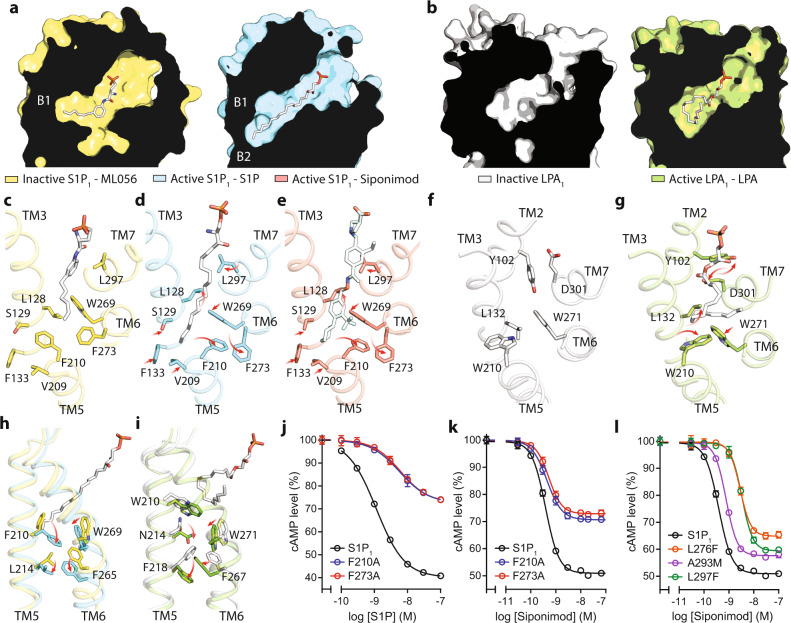
Fig. 5. Comparison of the activation mechanisms of lysophospholipid receptors.
a Slice through views of the orthosteric ligand binding pockets of S1P1 when bound with the antagonist ML056 (in yellow), or S1P (in cyan). b Slice through views of the orthosteric ligand binding pockets of LPA1 in the inactive (in white) or active (in green) states. c–e key residues for S1P1 activation are shown in sticks to illustrate the rotameric reorganization of their side chains at the bottom of the ligand-binding pocket, when bound with ML056 (c), S1P (d), or Siponimod (e). f, g Key residues for LPA1 activation are shown in sticks to illustrate the rotameric reorganization of their side chains, when in the inactive unliganded state (f), or in the active LPA-bound state (g). h, i The conformational changes are propagated from the bottom of the ligand-binding pocket to the G-protein binding pocket near TM5 and TM6, in S1P1 (h) and LPA1 (i). j–l Dose–response data from cells expressing different S1P1 constructs after stimulation with S1P or Siponimod. Data are shown as mean ± SEM of three experiments. The analysis was done using the log(agonist) vs. response function of Prism 8 (GraphPad). Source data are provided as a Source Data file.

