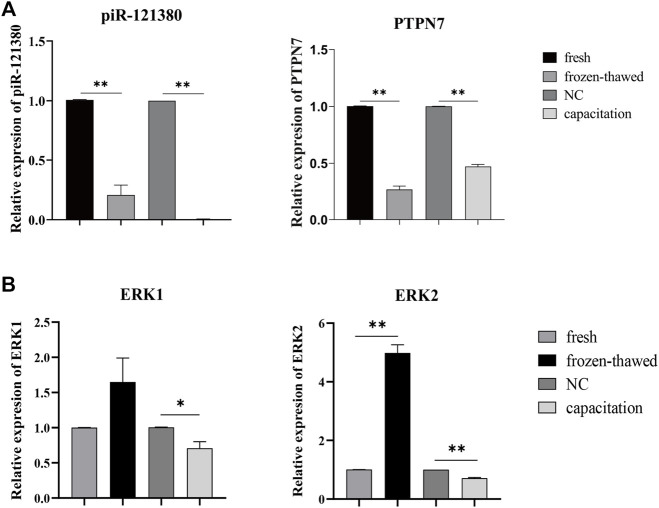
FIGURE 2.
(A) The expression levels of piR-121380 and PTPN7 in fresh, frozen–thawed, and capacitated sperm. **p < 0.01. (B) The expression levels of ERK1 and ERK2 in fresh, frozen–thawed, and capacitated sperm. **p < 0.01. *p < 0.05. The data are representative of at least three independent experiments (mean ± SEM).

