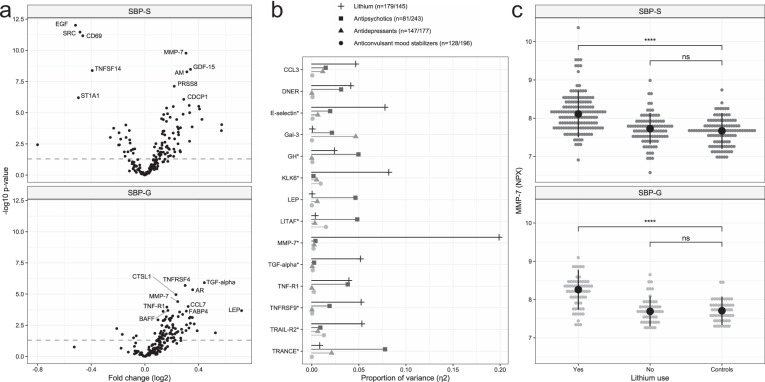
Fig. 1. Overview of case-control results and associations with psychiatric drugs.
a Volcano plots summarizing results from case-control analyses (T-test) in both cohorts. The horizontal line indicates P = 0.05. The top 10 altered proteins in each cohort are labeled. b Proportion of variance (η2 from ANOVA models) in protein normalized protein expression (NPX) values explained by each drug category where number of individuals with and without the drug are stated (e.g., 179 individuals were treated with lithium, 145 were not). Proteins with a Bonferroni-adjusted P-value < 0.2 are shown. *Bonferroni-adjusted P < 0.05. c Dot plot showing NPX-values of MMP-7 for each individual stratified by lithium use. P-values from T-tests. ****P < 0.0001, ns not significant. AM pro-adrenomedullin, AR amphiregulin, BAFF tumor necrosis factor ligand superfamily member 13B, CCL3 C-C motif chemokine 3, CCL7 C-C motif chemokine 7, CD69 early activation antigen CD69, CDCP1 CUB domain-containing protein 1, CTSL1 procathepsin L, DNER Delta and Notch-like epidermal growth factor-related receptor, EGF pro-epidermal growth factor, FABP4 fatty acid-binding protein, adipocyte, Gal-3 Galectin-3, GDF-15 growth/differentiation factor 15, GH somatotropin, KLK6 kallikrein-6, LEP Leptin, LITAF lipopolysaccharide-induced tumor necrosis factor-alpha factor, MMP-7 matrilysin, PRSS8 prostasin, SRC proto-oncogene tyrosine-protein kinase Src, ST1A1 sulfotransferase 1A1, TGF-alpha protransforming growth factor alpha, TNFRSF9 tumor necrosis factor receptor superfamily member 9, TNF-R1 tumor necrosis factor receptor superfamily member 1A, TNFRSF4 tumor necrosis factor receptor superfamily member 4, TNFSF14 tumor necrosis factor ligand superfamily member 14, TRAIL-R2 tumor necrosis factor receptor superfamily member 10B, TRANCE tumor necrosis factor ligand superfamily member 11, SBP-S/G St. Göran bipolar project Stockholm/Gothenburg.

