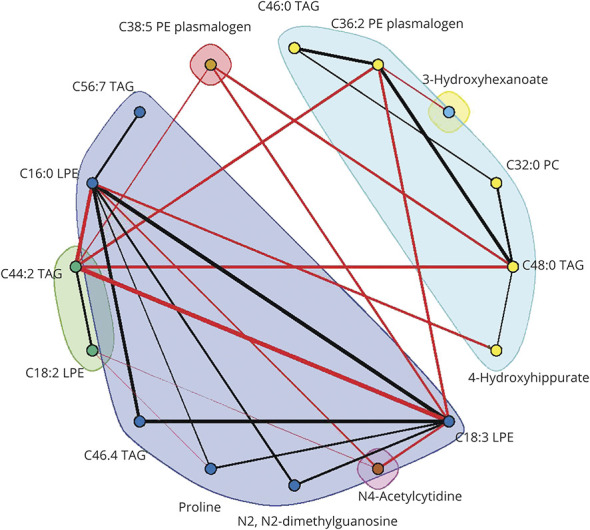
Figure 4. Differential Network of 16 Nodes and 28 Edges Comparing Ischemic Stroke Cases to Controls in the Nurses' Health Study (NHS).

Edges included in the differential network satisfied a false discovery rate p value threshold of 0.05. Edge width is proportional to the magnitude of the difference in partial correlation between ischemic stroke cases and controls. Red edges indicate edges with higher partial correlation in the stroke cases relative to controls; black edges indicate edges with higher partial correlation in the controls relative to stroke cases. Node colors denote community membership.
