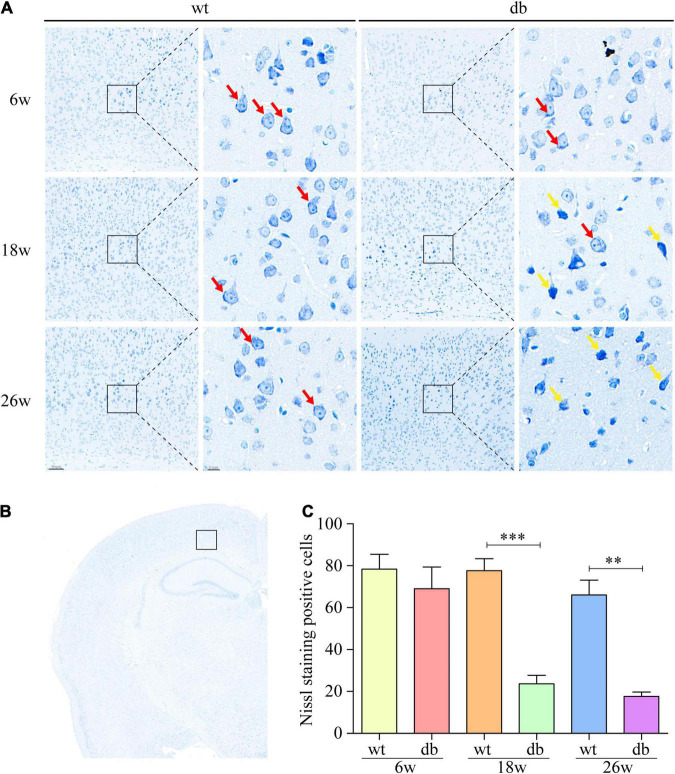
FIGURE 2.
Nissl staining was used to analyze the pathological changes of neuronal cells in mice. (A,B) Representative Nissl staining of neurons in the cortex at different ages. Scale bar = 50 or 10 μm. The red arrow points to the Nissl body. The yellow arrow points to damaged neurons. (C) Quantitative analysis of Nissl body positive cells. (n = 3 per group); **P < 0.01; ***P < 0.001.

