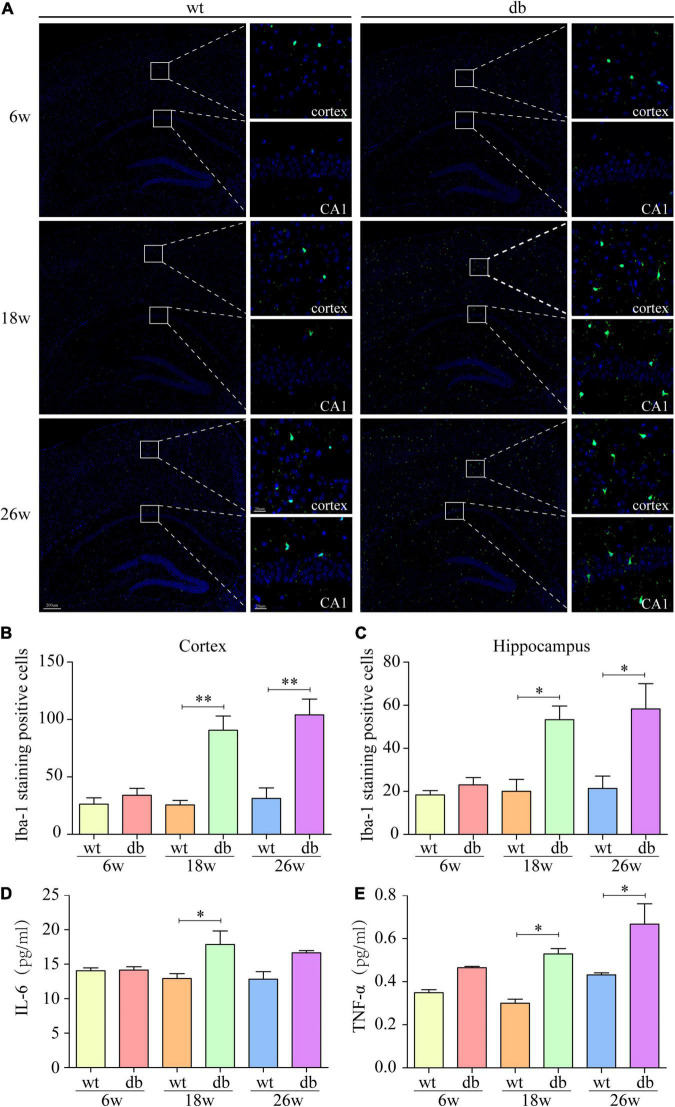
FIGURE 4.
Increased microgliosis and pro-inflammatory cytokines in db/db mice with age. (A) Representative immunofluorescent staining of Iba-1-positive microglia in the cortex and hippocampus of mice. Scale bar = 200 or 20 μm. (B,C) Quantification of Iba-1-staining positive cells within the cortex or the hippocampus. (D,E) MSD was performed to detect the protein levels of IL-6 and TNF-α. (n = 3 per group); *P < 0.05; **P < 0.01.

