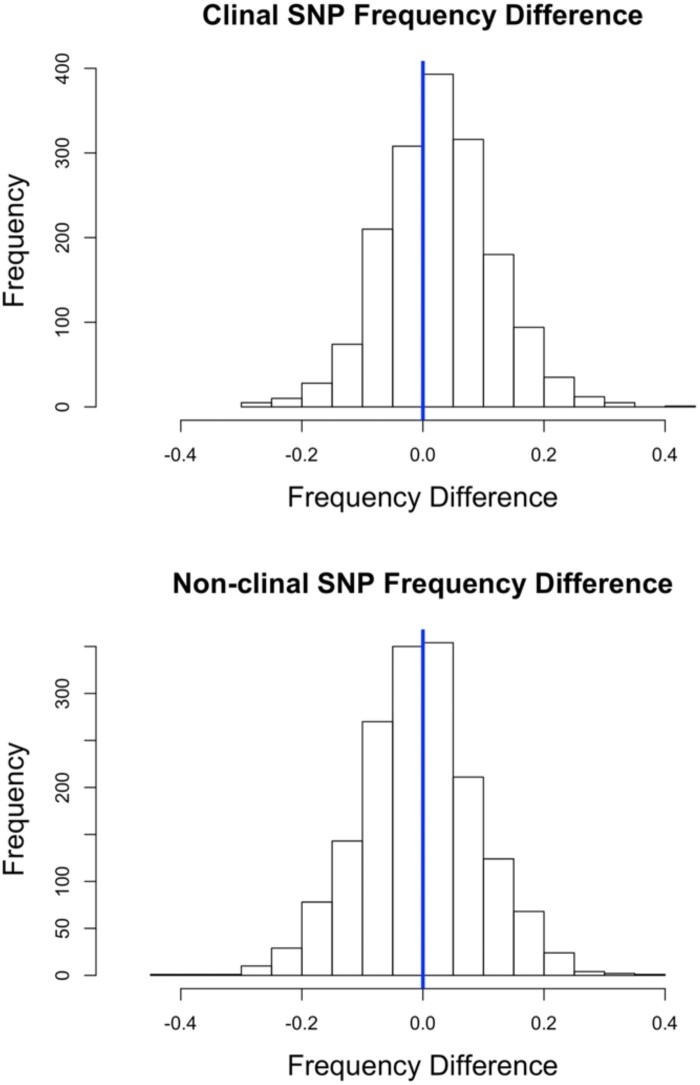
Fig. 4.
Northern-associated alleles at clinal outlier SNPs have tended to increase in frequency over time. The top histogram depicts 1,671 frequency differences of northern-associated alleles at clinal outlier SNPs. The bottom histogram depicts the frequency difference at 1,671 SNPs chosen at random across the genome.

