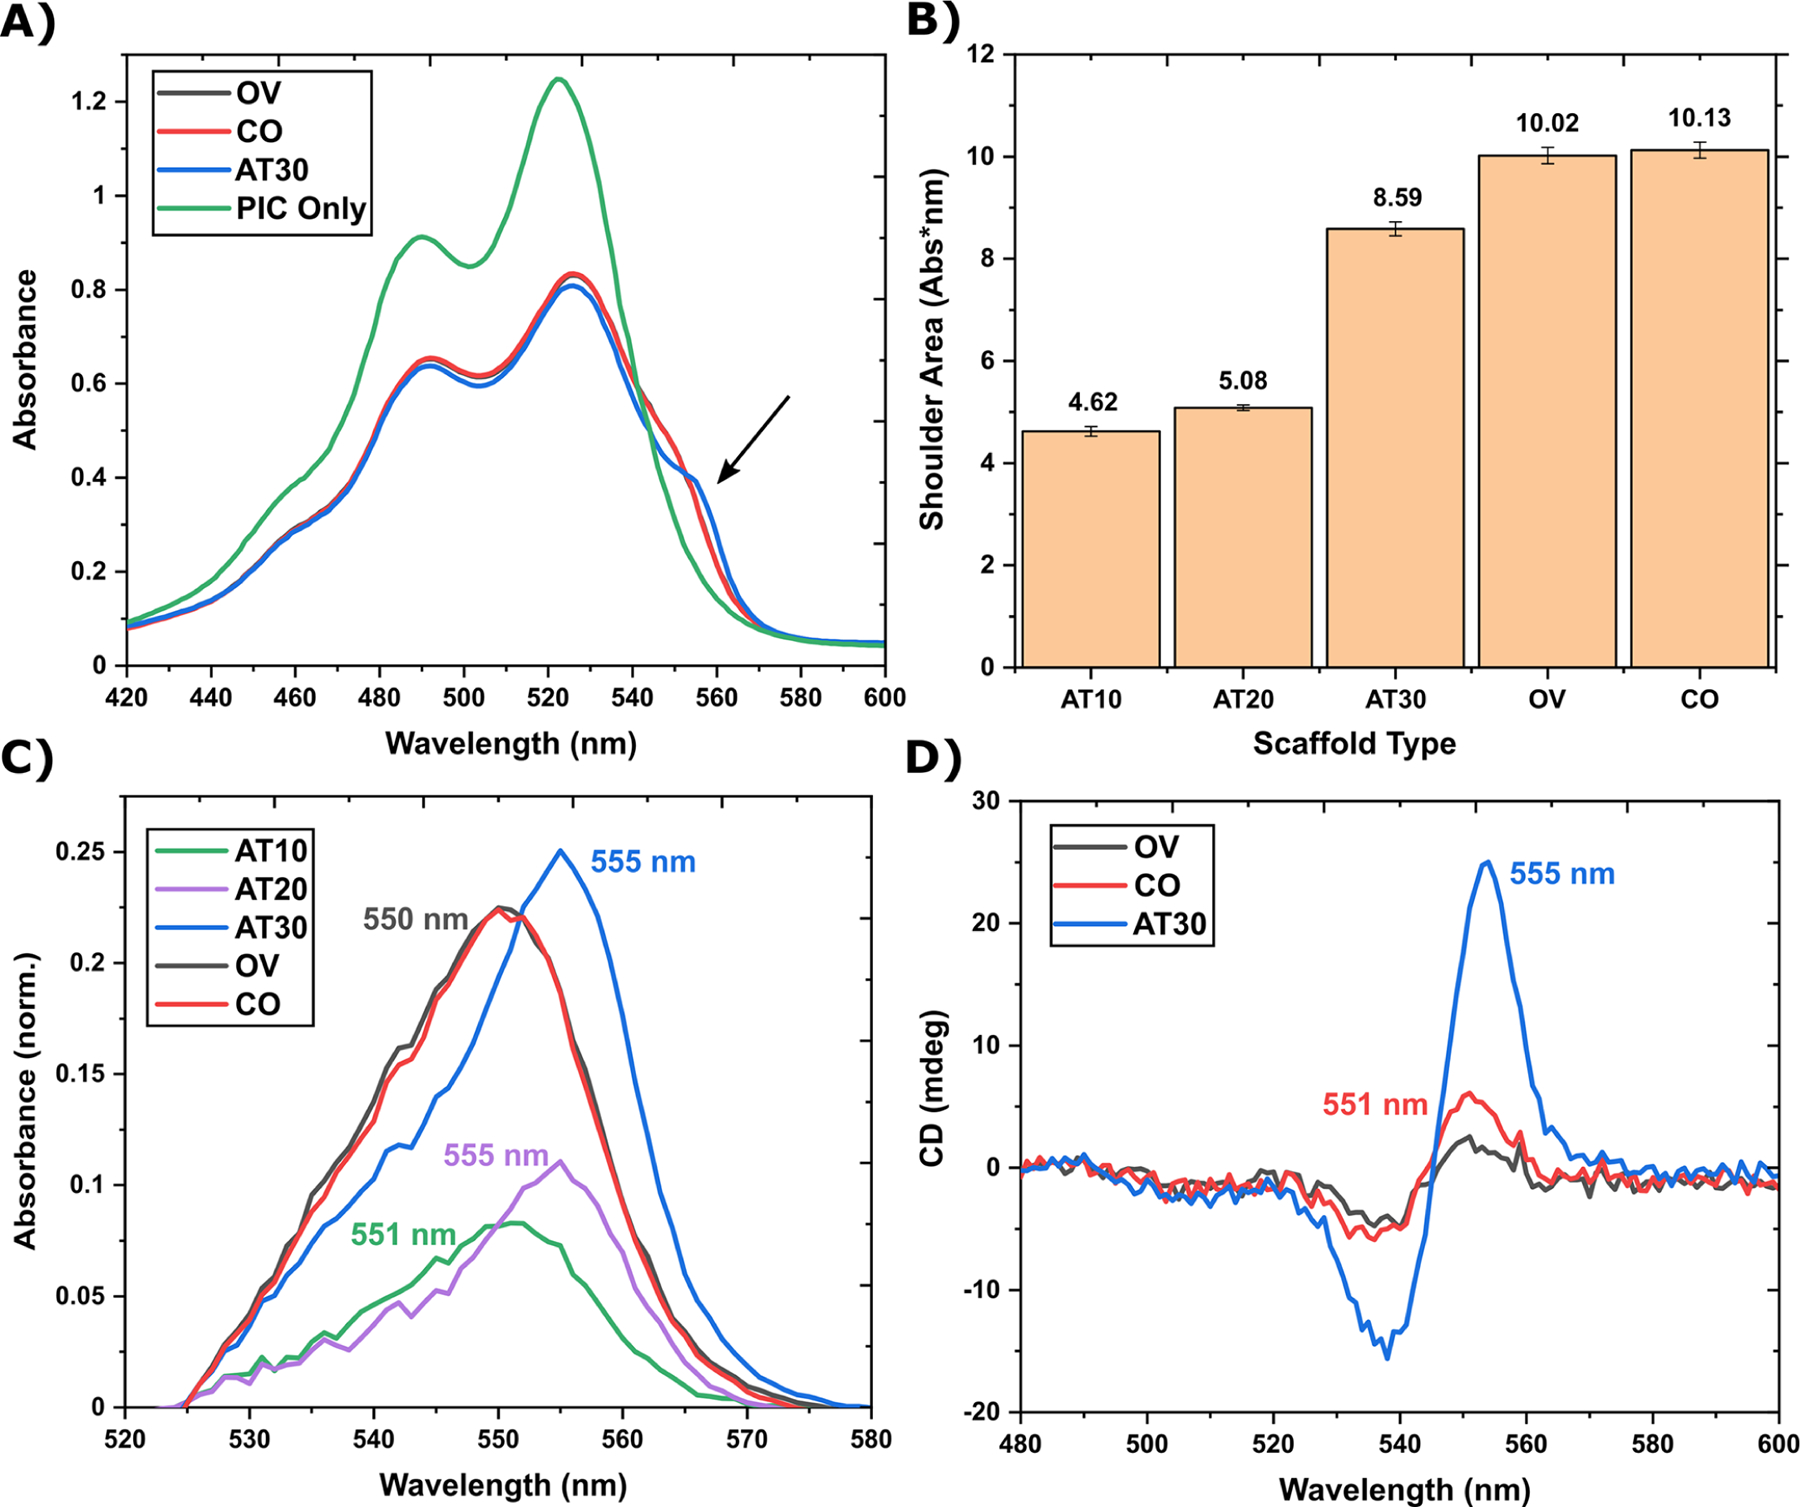
Figure 3.

J-bit formation in noncontiguous AT-tracks. (A) Absorbance spectra comparing the AT30 (blue) scaffold to OV (gray) and CO (red) scaffolds (OV overlaps with CO). The arrow indicates J-shoulder location. (B) Quantification of the area under the J-shoulder. J-shoulder area is not statistically different between OV and CO structures (i.e., within 1 standard deviation). (C) Absorbance spectra comparing AT10 (gray), AT20 (red), AT30 (blue), OV (green), and CO (purple) J-shoulders. The shown spectra were the result of average spectra normalized to the 0−0 transition (∼523 nm), and then the GC spectra were subtracted as a baseline. Labels indicate λmax. (D) CD spectra comparing the same data set in panel (A). Labels indicate λmax. In all spectra, DNA is 400 nM and the PIC dye is 52 μM.
