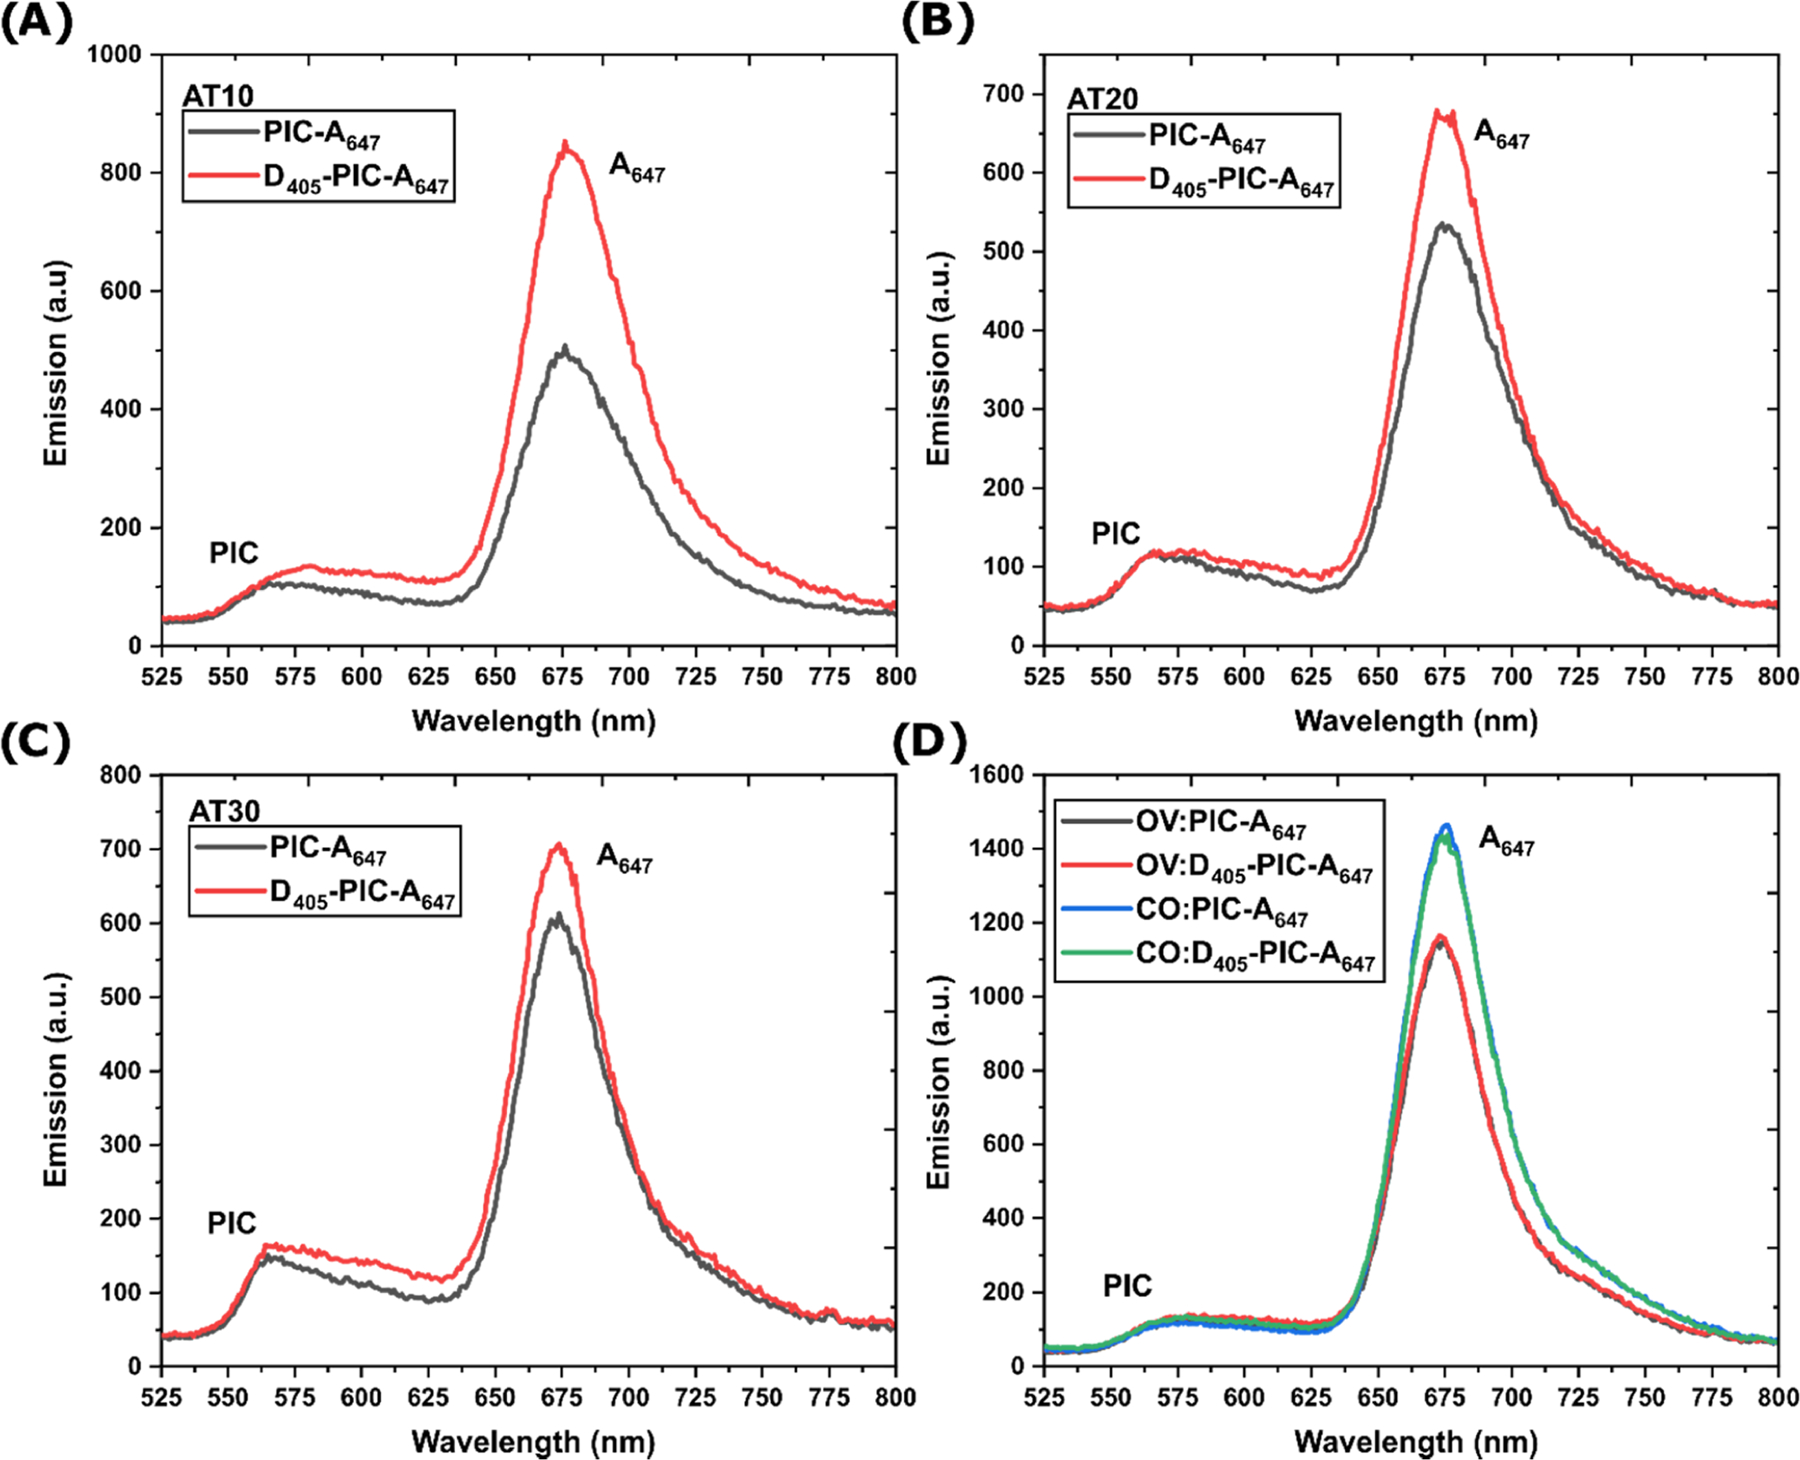
Figure 4.

Energy transfer through the PIC relay and fluorescence emission. Fluorescence emission spectra comparing (A) AT10, (B) AT20, (C) AT30, and (D) OV and CO scaffolds with and without the AF405 donor present. Each sample contains 400 nM DNA and 52 μM. PIC. Full spectra including the D405 portion are in Figure S13.
