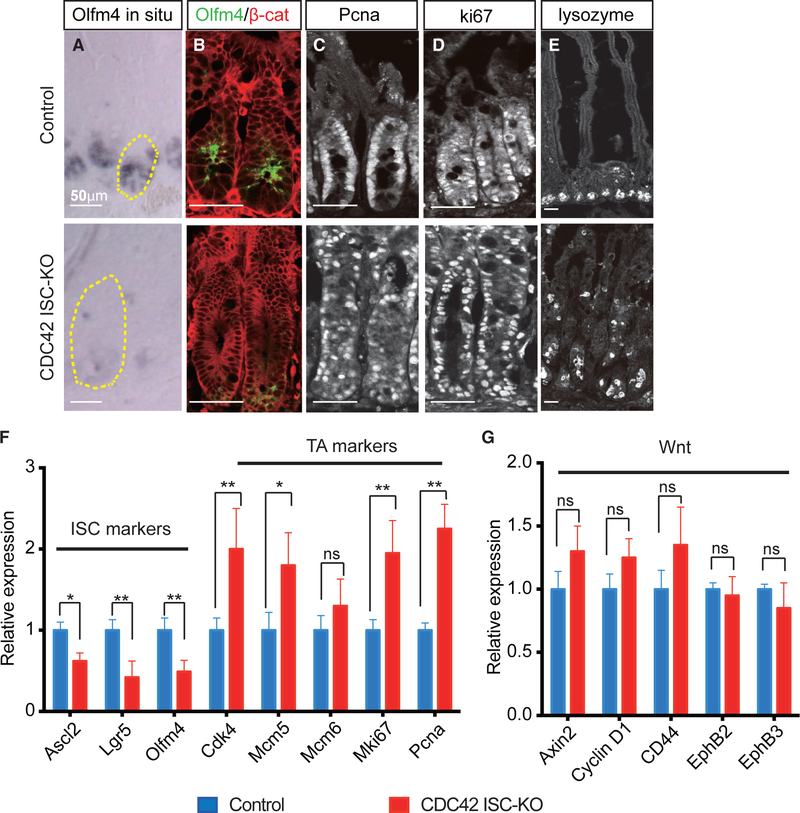
Figure 2. Loss of CDC42 in ISCs increases proliferation in TA cells at the expense of ISCs.
(A) Representative images of in situ staining of duodenal sections; one crypt is circled in each image.
(B–E) Representative images of immunofluorescence staining of duodenal sections: anti-Olfm4, anti-β-catenin, anti-Pcna, anti-Ki67, and anti-lysozyme.
(F and G) Relative mRNA levels of ISC markers, TA cell markers, and Wnt pathway markers in isolated small intestinal crypts. Data are mean ± SD. *p < 0.05, **p < 0.01; ns, not significant.
Data are representative of at least three independent experiments. Scale bars, 50 μm. n = 4 for each genotype.

