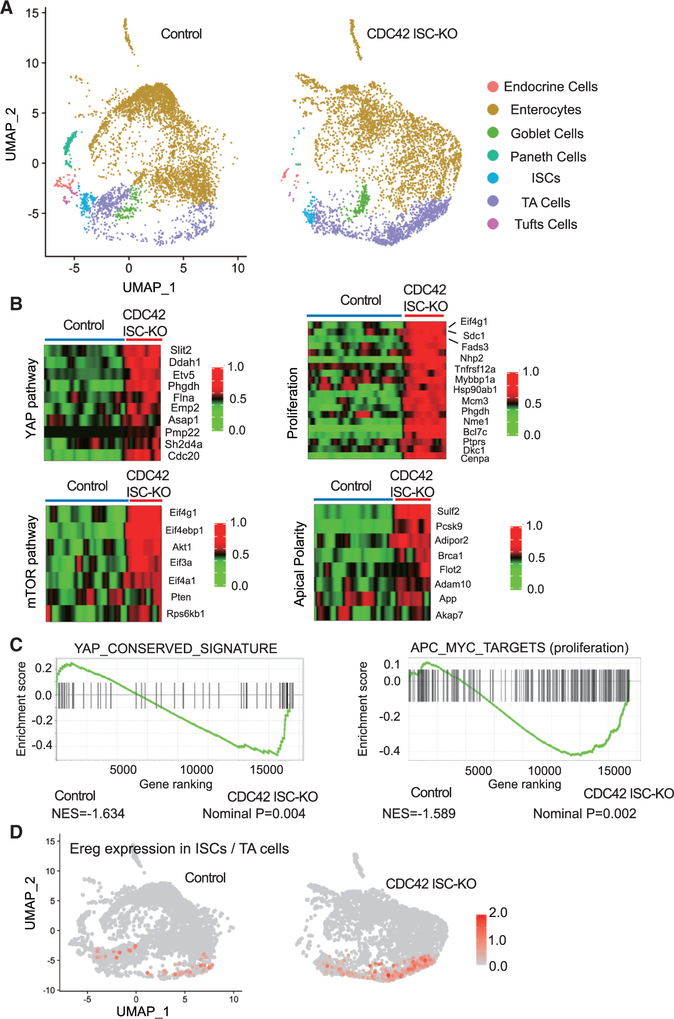
Figure 3. YAP and mTOR signaling activities are increased in CDC42-depleted TA cells and ISCs.
(A) Single-cell RNA-seq analysis of isolated single cells from duodenal crypts by UMAP clustering.
(B) Heatmap of most differentially expressed genes in the YAP pathway (10 genes), mTOR pathway (7 genes), proliferation pathways (15 genes), and apical polarity pathways (8 genes) in control and CDC42 ISC-KO ISC cluster. Columns indicate individual cells; rows indicate genes. n refers to gene numbers.
(C) GSEA pathway enrichment map for YAP and proliferation pathways from cells in the ISC cluster.
(D) Expression level of Ereg in ISC and TA cell cluster.
Data from one experiment. n = 1 for each genotype.

