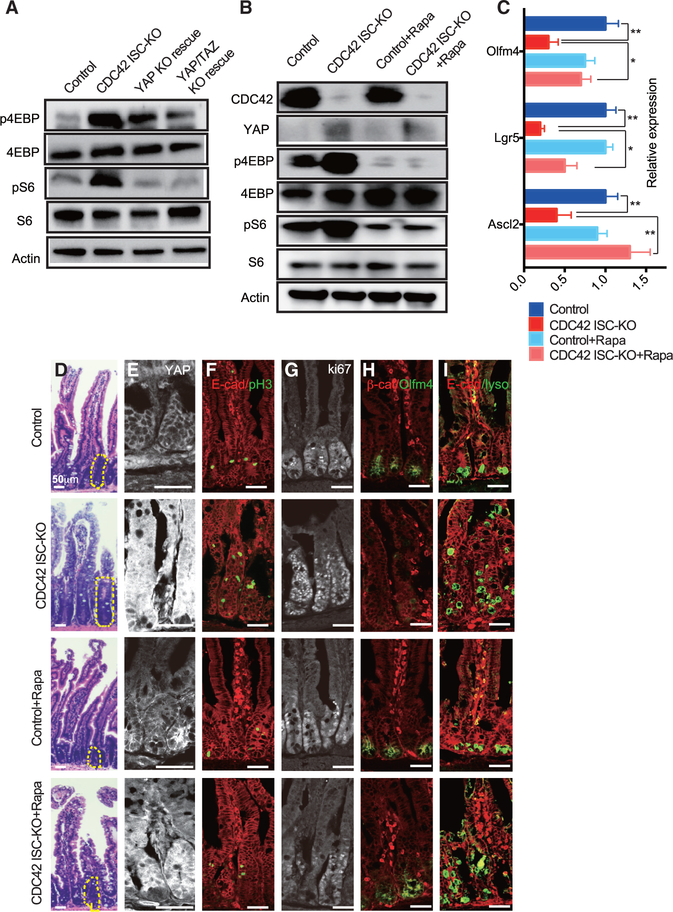
Figure 5. Inhibition of mTOR signaling by rapamycin rescues ISCs and reduces TA cell population.
CDC42 ISC-KO and controls were injected with TAM once per day for 3 consecutive days, followed by 3 consecutive days of PBS or rapamycin injection, then sacrificed 24 h after the third rapamycin injection.
(A and B) Small intestinal crypts were isolated, lysed, and western blotted for CDC42 and mTOR pathway effector S6 and 4EBP. Actin represents the loading control.
(C) Relative mRNA levels of ISC markers in isolated small intestinal crypts. Data are mean ± SD. *p < 0.05, **p < 0.01.
(D) Representative images of H&E staining of duodenal sections; one crypt is circled in each image.
(E–I) Representative images of immunofluorescence staining of duodenal sections: anti-YAP, anti-E-cad, anti-pH3, anti-Ki67, anti-b-catenin, anti-Olfm4, anti-E-cad, and anti-lysozyme.
Data are representative of at least three independent experiments. Scale bars, 50 μm. n = 4 for each genotype.

