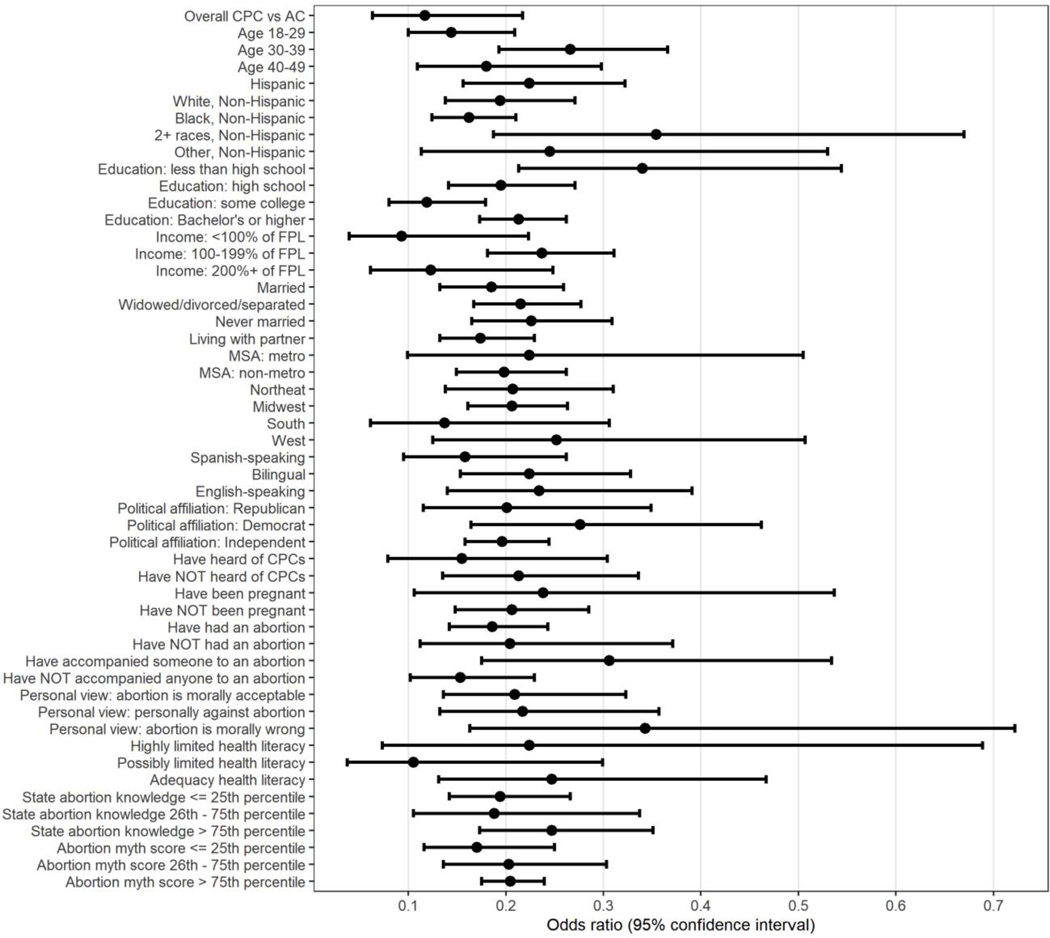
Figure 2. Odds of correct identification of crisis pregnancy centers versus correct identification of abortion clinics by patient characteristics.
Forest plot shows bivariate association between sociodemographic and reproductive characteristics with performance on a web-based survey in which participants were shown a website screenshot of a crisis pregnancy center or abortion clinic and asked, “If a woman were seeking an abortion, could she have one at this center?” The plot compares the odds of correctly identifying a crisis pregnancy center as a non-abortion providing facility versus correctly identifying an abortion clinic as providing abortion. State abortion law knowledge was scored on the basis of a 12-item assessment and abortion myth score was on the basis of a 5-item assessment.(Swartz et al., 2020) In both assessments, higher percentiles represent more correct 431 answers.
FPL, federal poverty level; MSA, metropolitan statistical area.

