
Figure 10. Top scoring gene sets can be broken down into characteristic genes for each cell type.
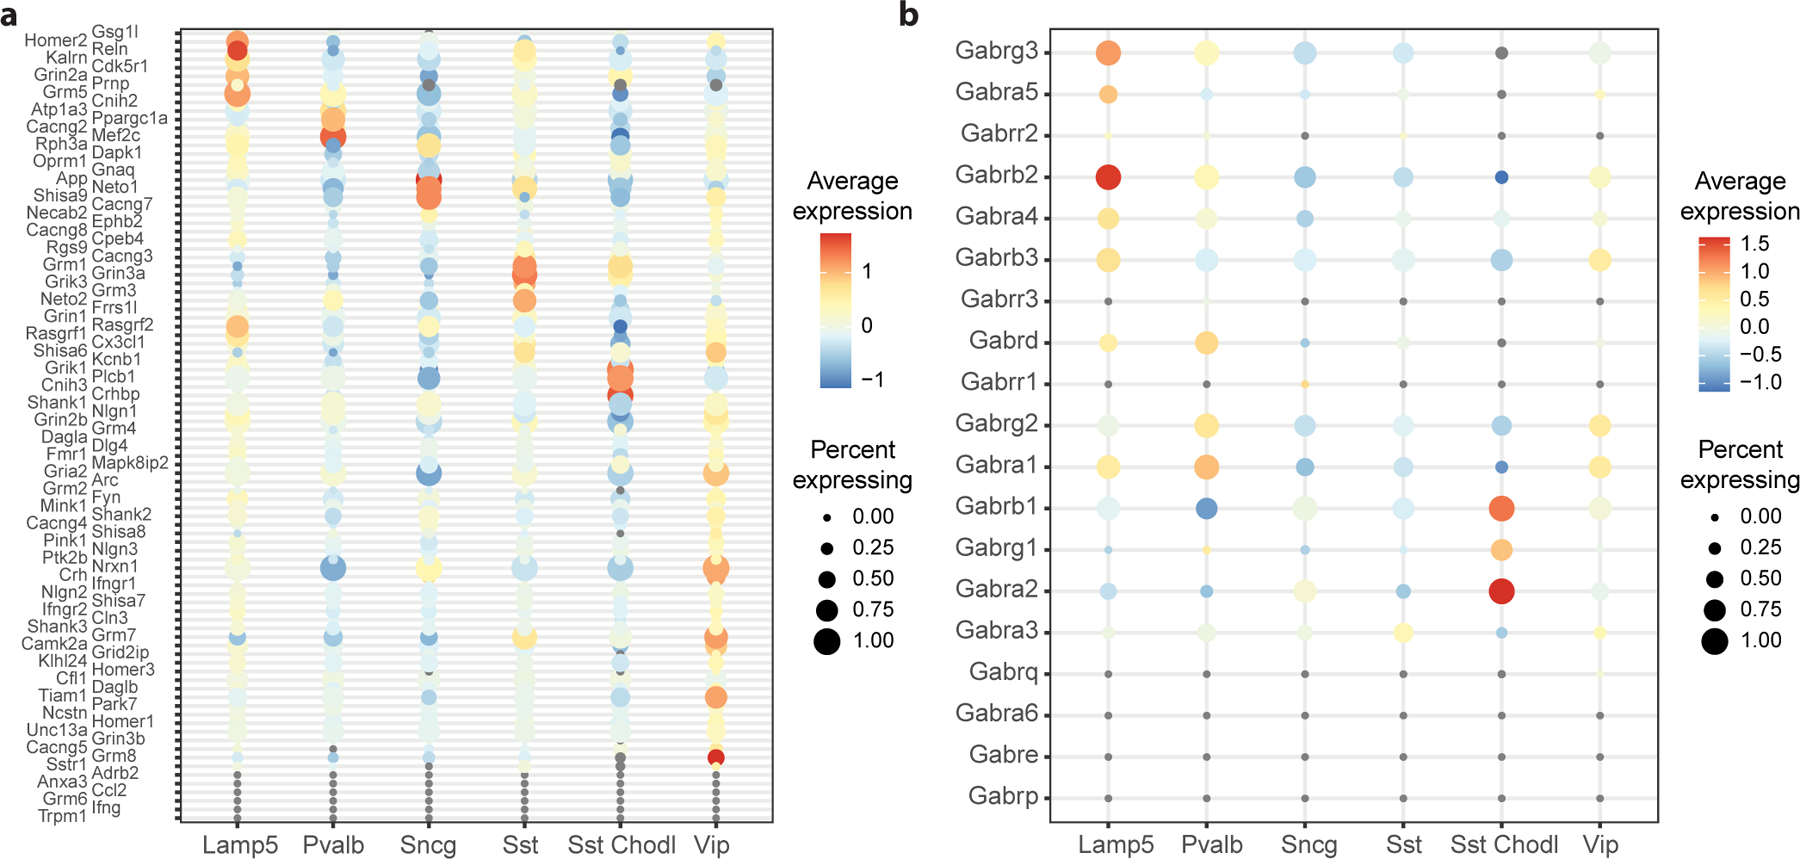
a Dot plot of genes from the “Glutamate receptor signalling pathway” Gene Ontology term, where cell types are shown on the x-axis and genes are shown on the y-axis. For each cell type, the dot size corresponds to the fraction of cells expressing a given gene, the color corresponds to the z-scored average expression level, averaged across datasets. b Same as a, for the “GABA-A receptor complex” Gene Ontology term.