
Figure 15. MetaNeighbor finds replicable cell types in a multi-modal dataset of the mouse primary motor cortex.
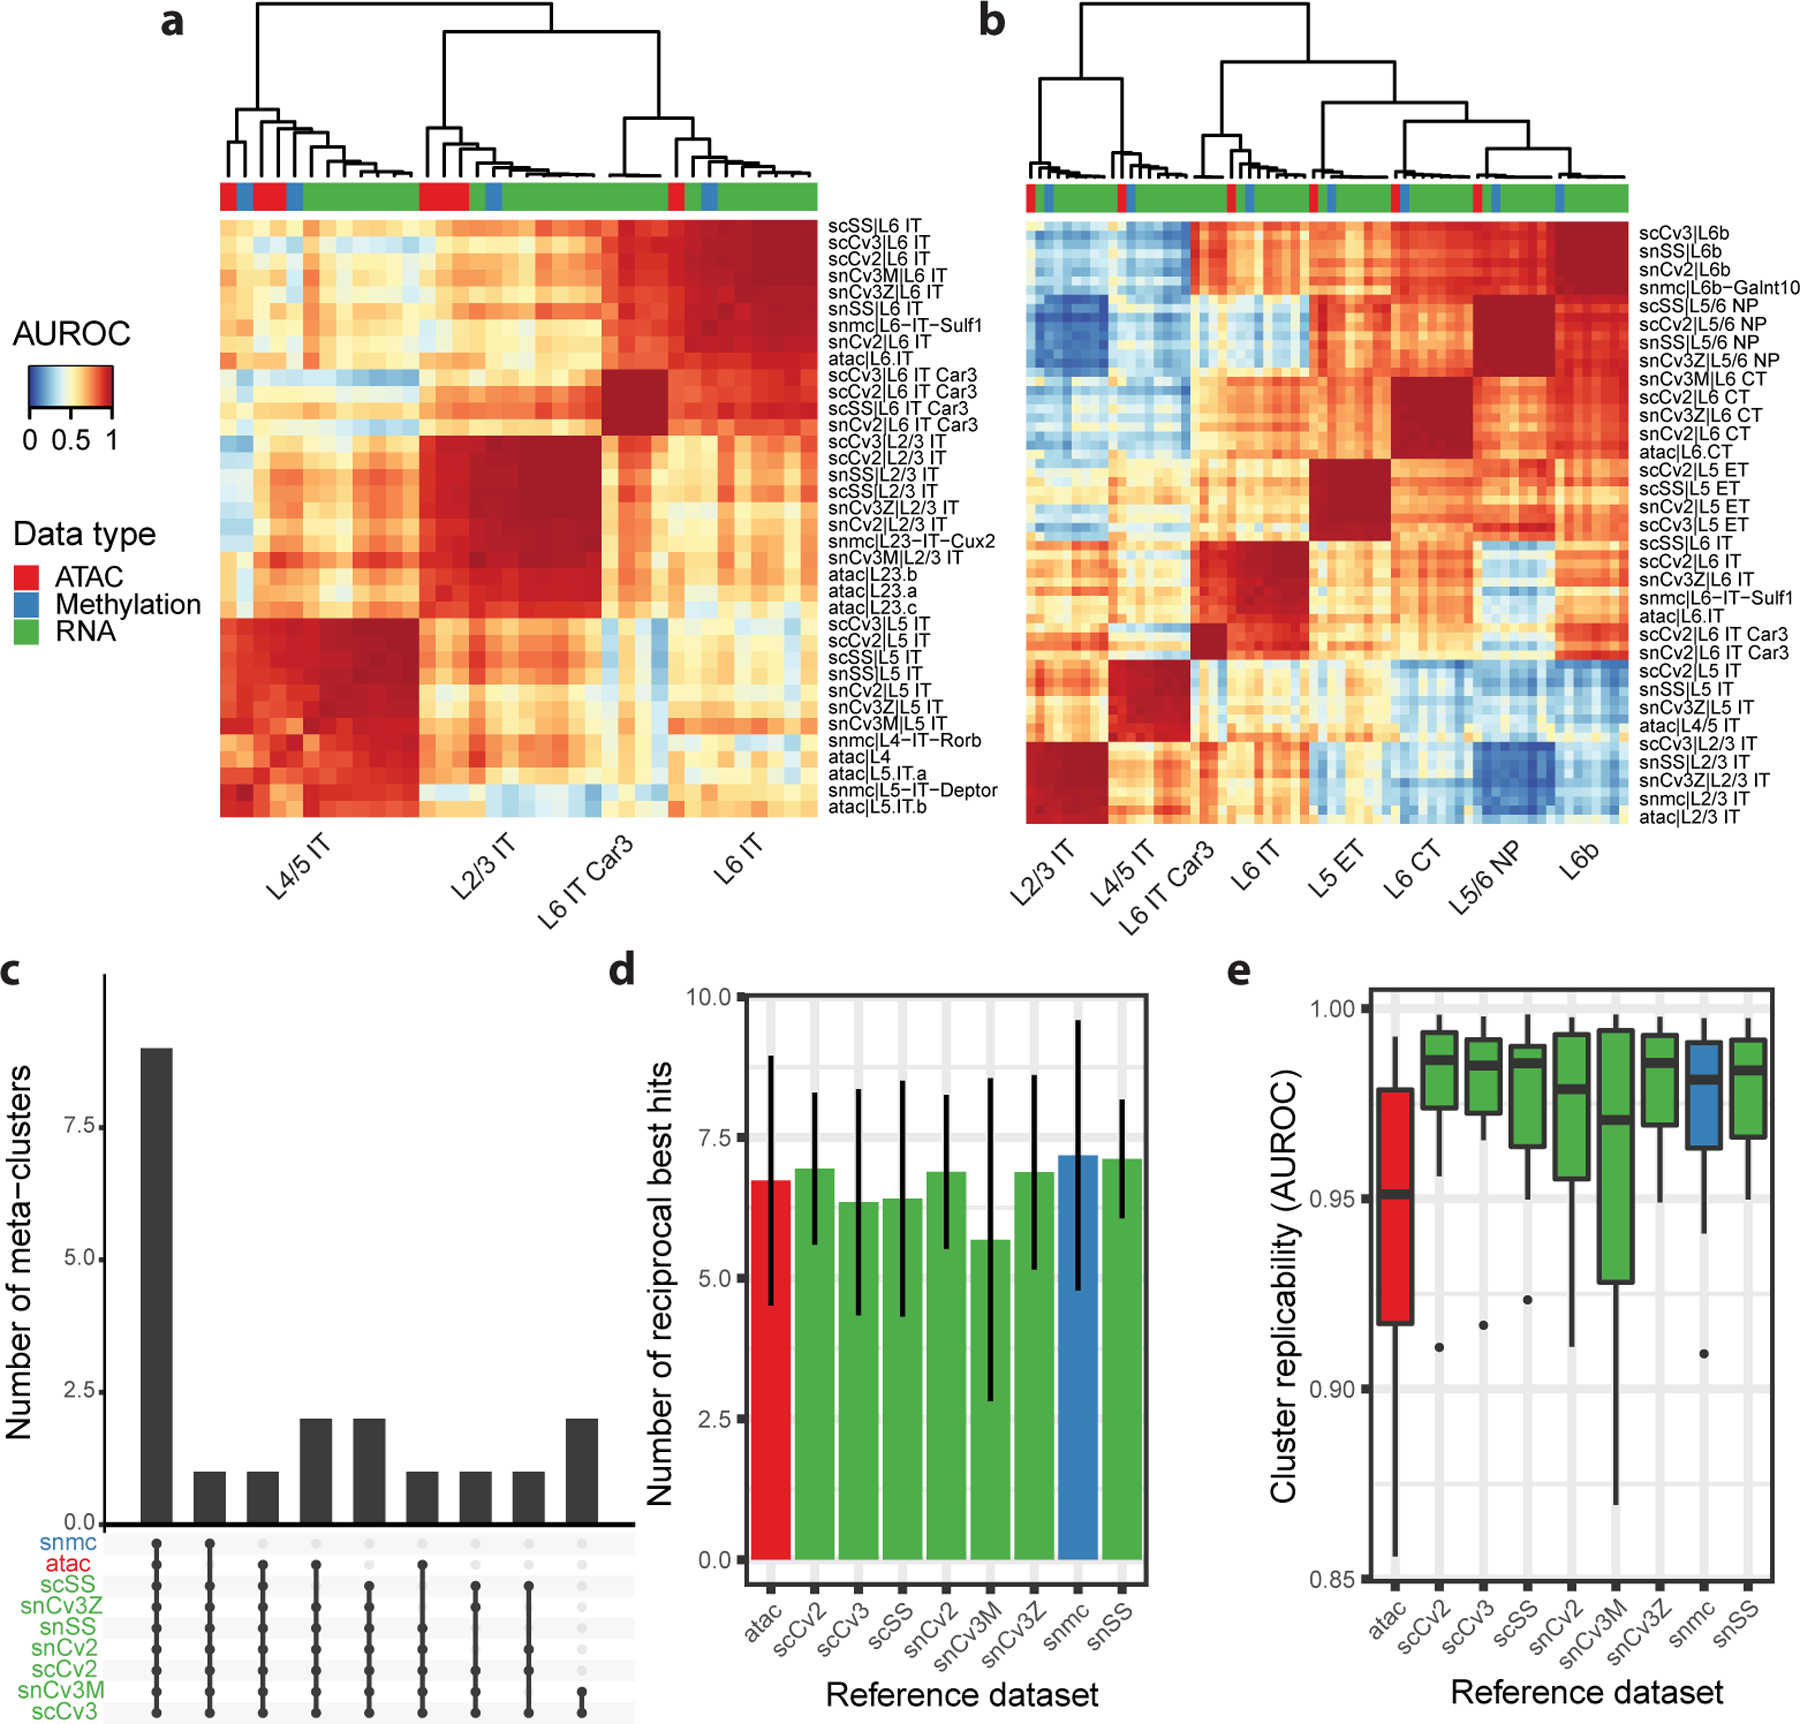
a Heatmap based on MetaNeighbor AUROCs for Intra-Telencephalic (IT) projecting cell types, where cell types are grouped by applying hierarchical clustering. Column annotation colors indicate the sequencing modality (expression, chromatin accessibility or methylation). b Heatmap based on MetaNeighbor AUROCs for excitatory cell types, where cell types are grouped by applying hierarchical clustering. Column annotation colors as in a. c Upset plot showing the number of cell types that replicate across given combinations of datasets (meta-clusters). For example, 9 cell types were found to replicate across all datasets. d Number of reciprocal best hits for each dataset in the primary motor cortex compendium. The height of each bar indicates the average number of hits across cell types, the line indicates the standard deviation. e Boxplot showing the strength of cluster replicability (MetaNeighbor AUROC) across cell types for each dataset in the primary motor cortex compendium. The lower and upper hinges of the boxplots represent the first and third quartile, the central line represents the median, the upper (resp. lower) whisker extends to the largest (resp. smallest) value within 1.5 IQR (Inter-Quartile Range) of the hinge. All points beyond 1.5 IQR are drawn individually.