
Figure 16. MetaNeighbor AUROCs offer a generalizable and batch-effect-free quantification of cell type similarity.
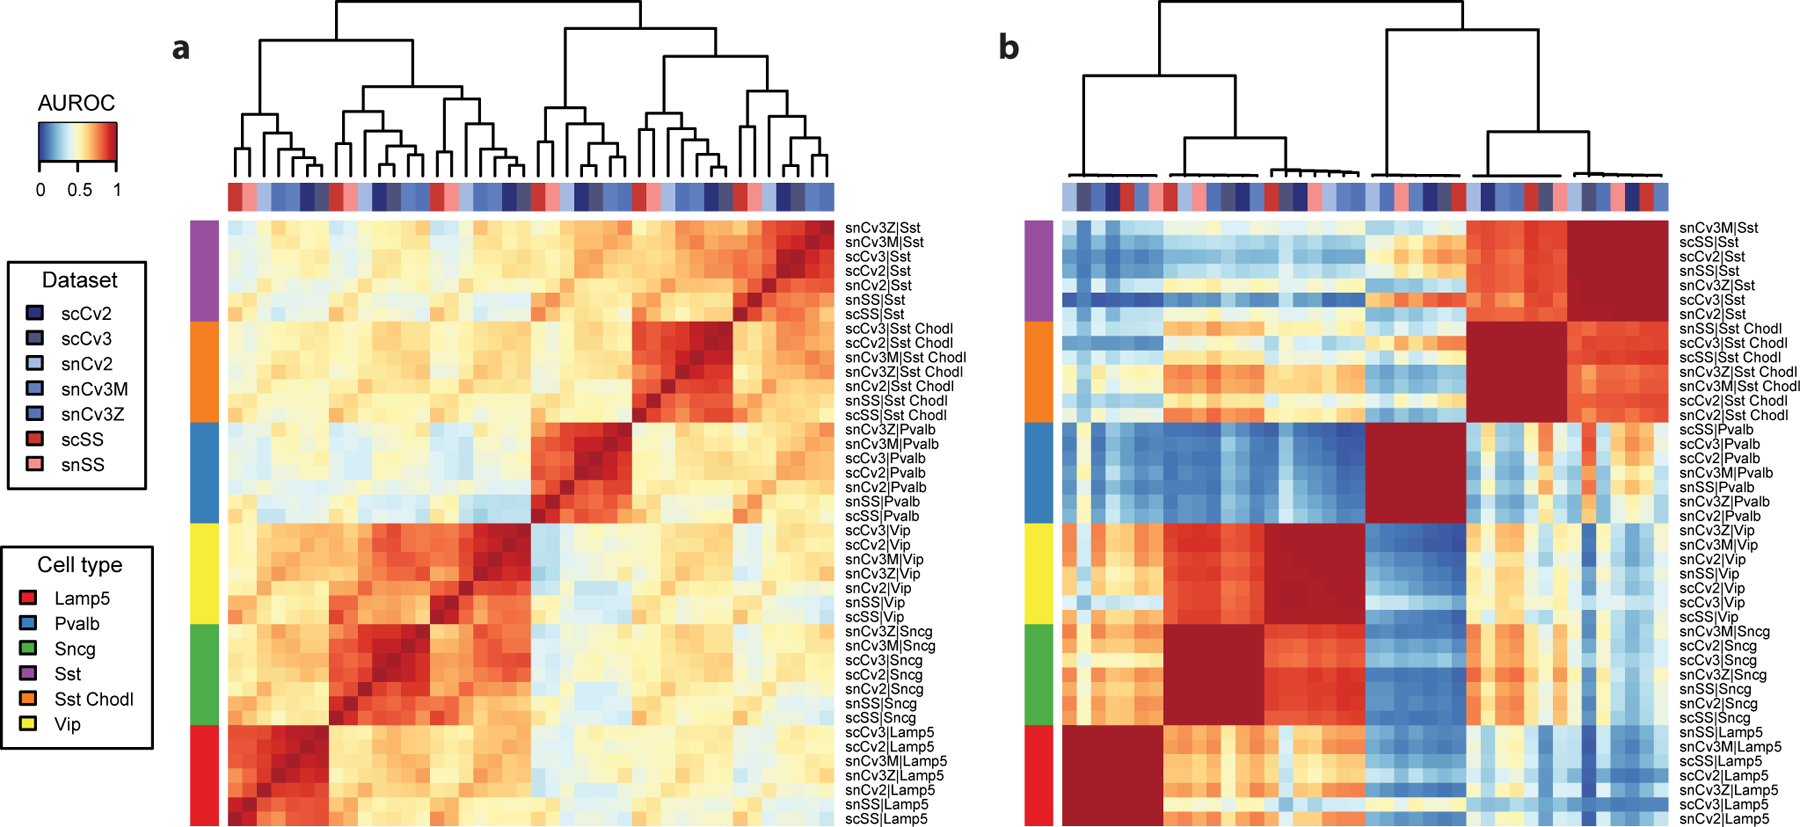
a Possible issue: Spearman correlation of cell type centroids is affected by technical variability. The heatmap shows some evidence of replicating cell types (light red rectangles), but is dominated by batch effects, largely obscuring secondary relationships between cell types. Red colors correspond to datasets using the Smart-Seq technology, blue colors to datasets using the 10x technology, light colors to single nuclei datasets, dark colors to single cell datasets. b Anticipated result: MetaNeighbor AUROCs alleviate most of the concerns seen in a, with clear groups of replicating cell types (dark red squares, AUROC ~ 1) and clear secondary relationships (e.g., similarity of CGE-derived interneurons Vip, Sncg and Lamp5).