
Figure 4. 1-vs-best AUROCs automatically identify each cell type’s closest outgroup.
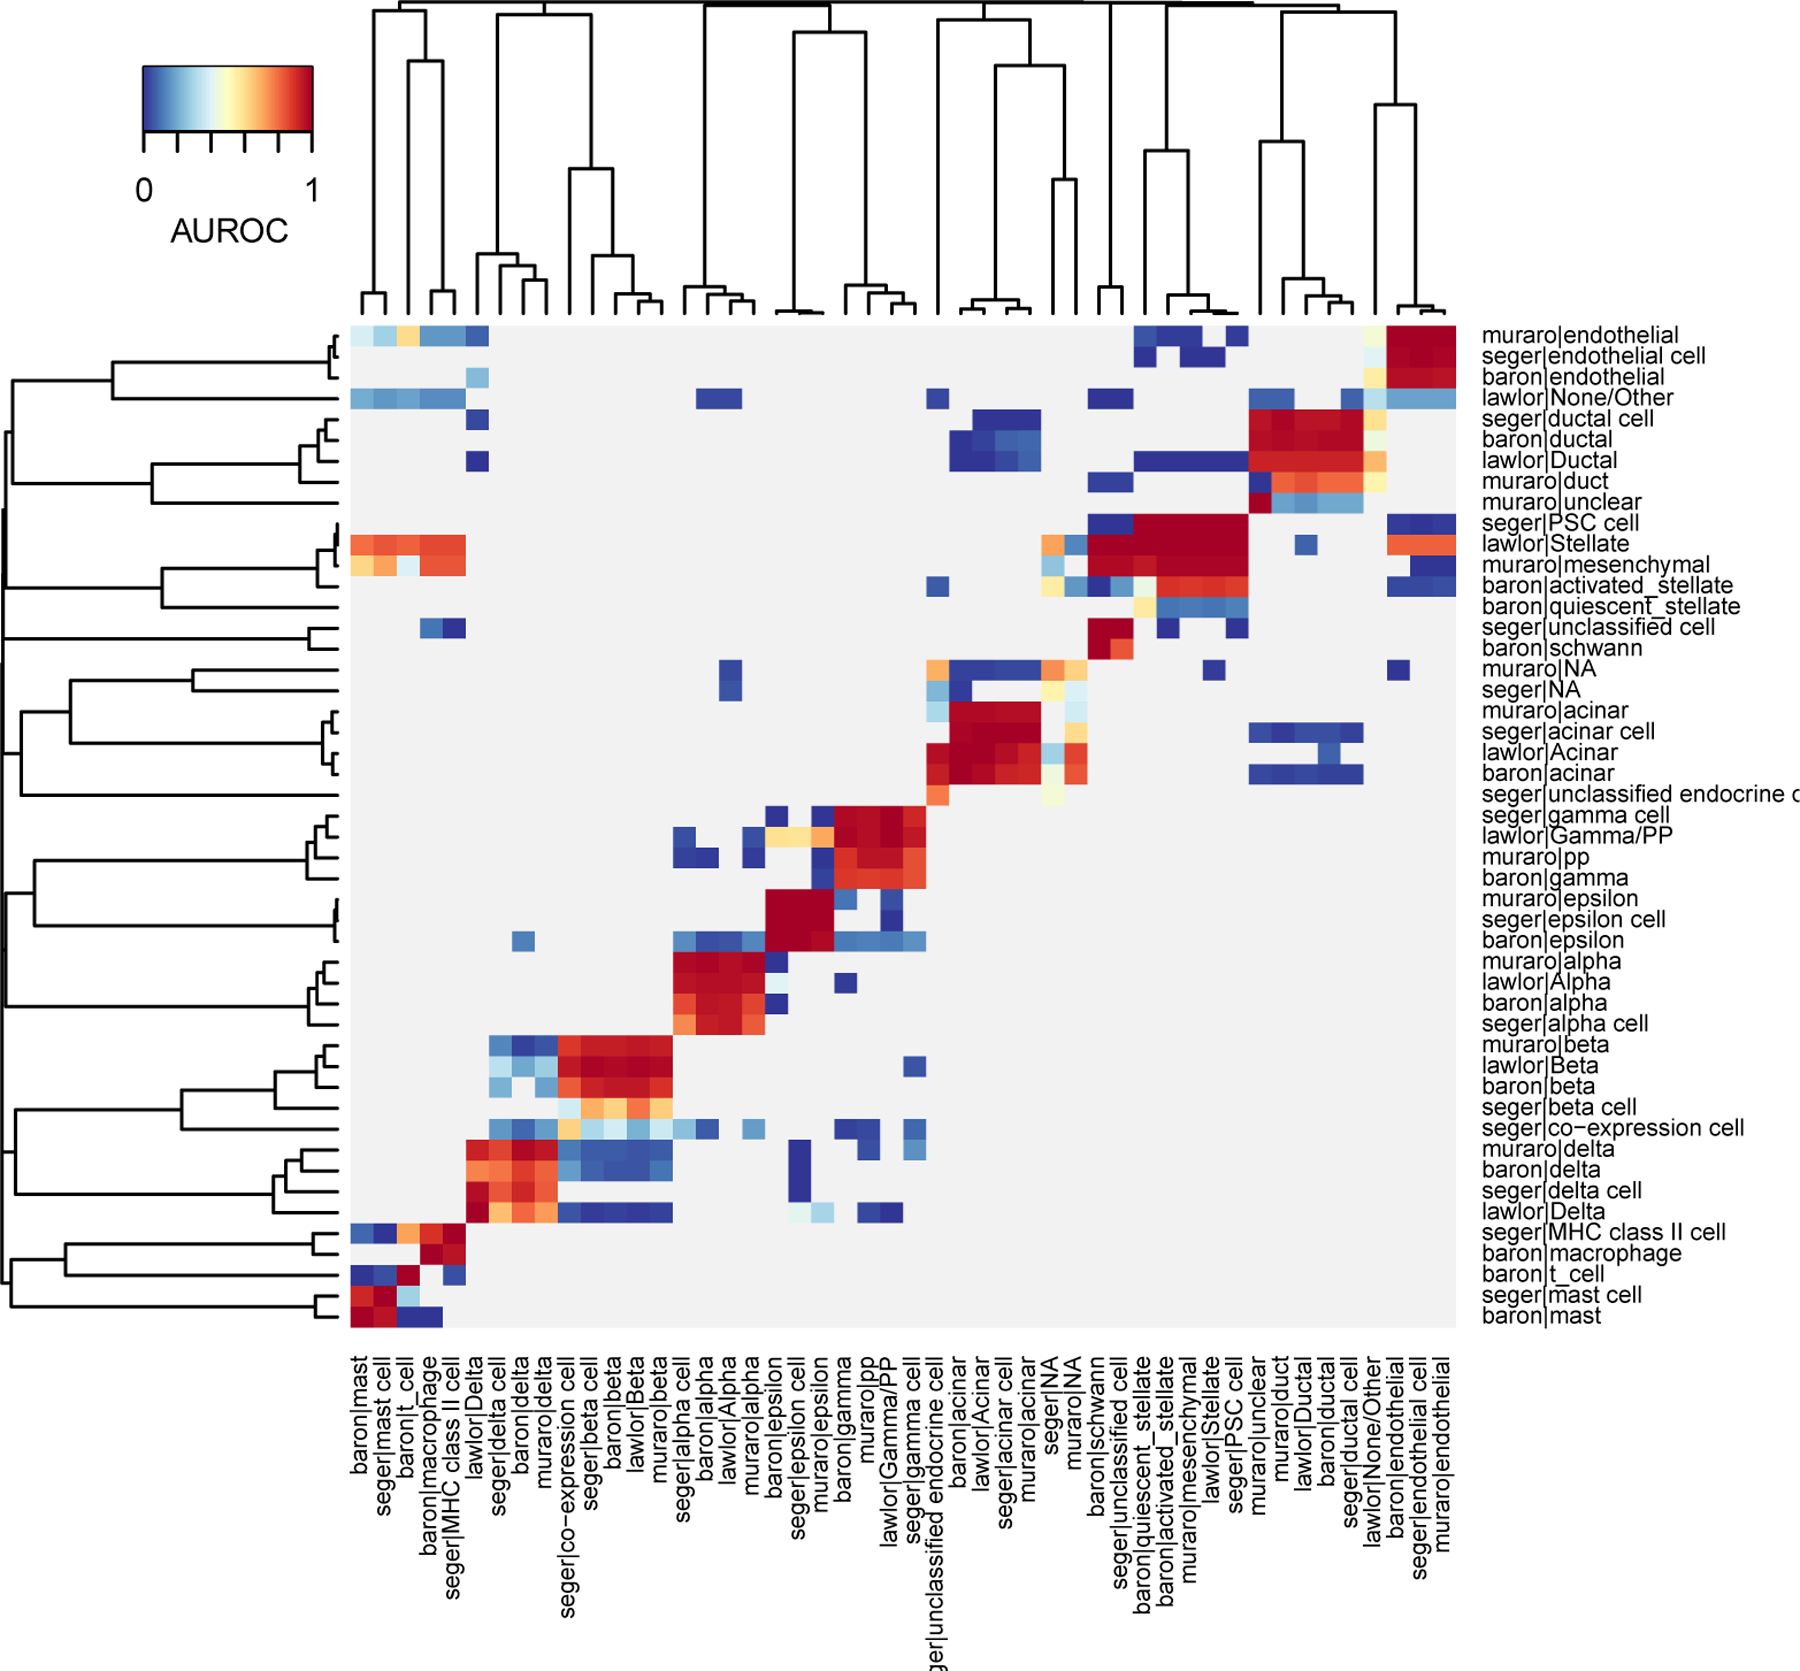
Heatmap based on MetaNeighbor 1-vs-best AUROCs, where cell types are grouped by applying hierarchical clustering. Reference cell types are shown as columns, target cell types are shown as rows. Red values indicate each reference cell type’s best hit, blue values the closest outgroup (one value per target dataset). All other cell type combinations are shown in gray.