
Figure 9. A small fraction of functional gene sets contributes highly to cell type replicability.
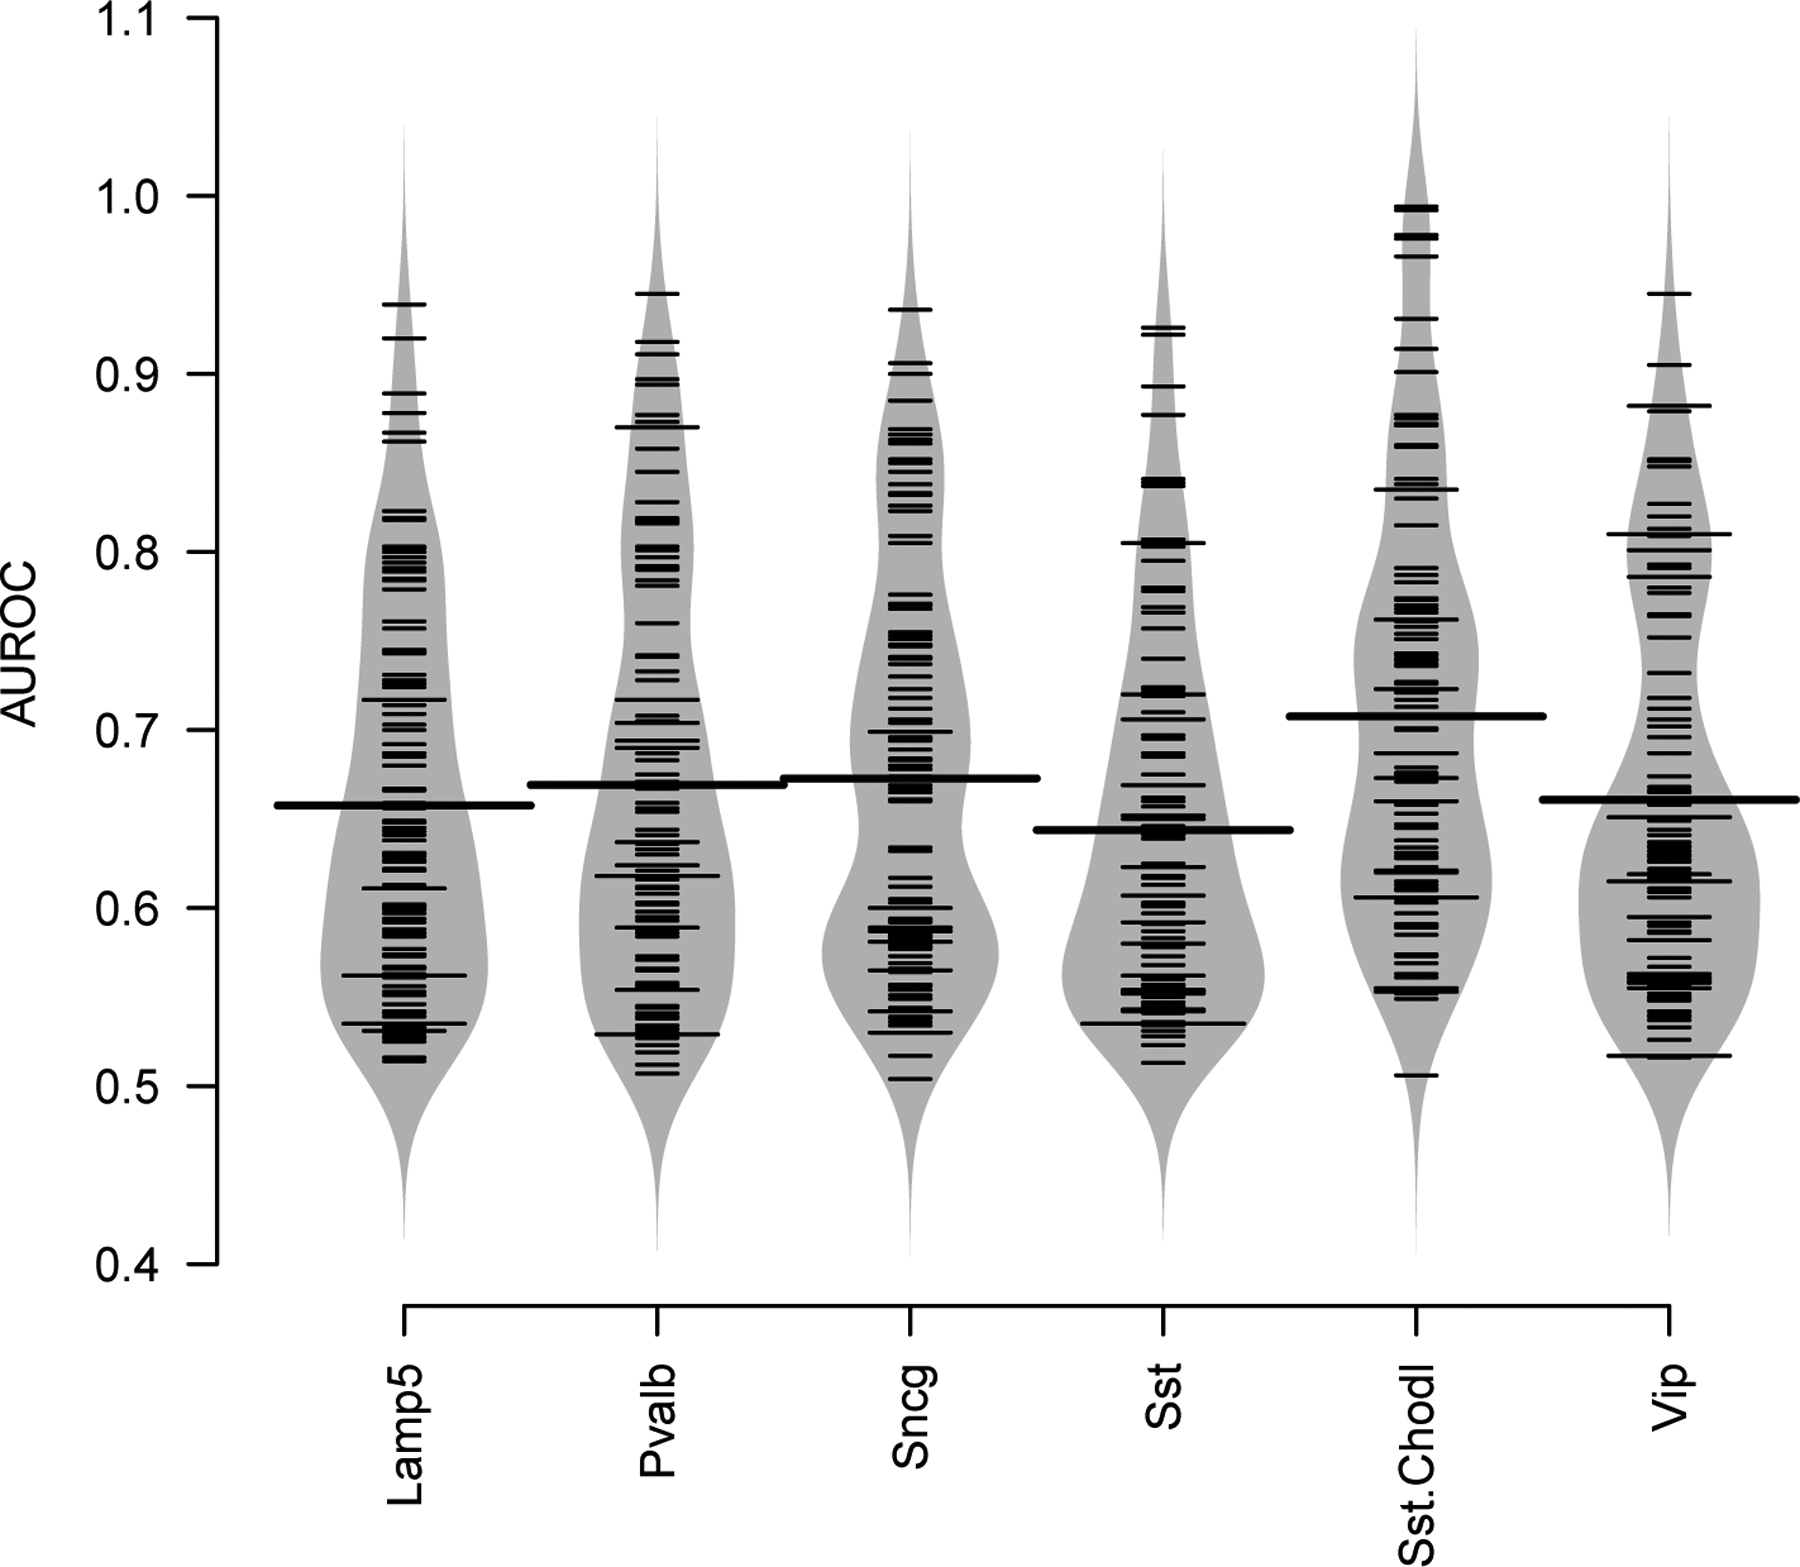
For each cell type, large ticks represent the average AUROC across gene sets. Each smaller tick represents an individual gene set, the envelope is a violin-plot style approximation of the distribution of performance across gene sets.