Fig. 3.
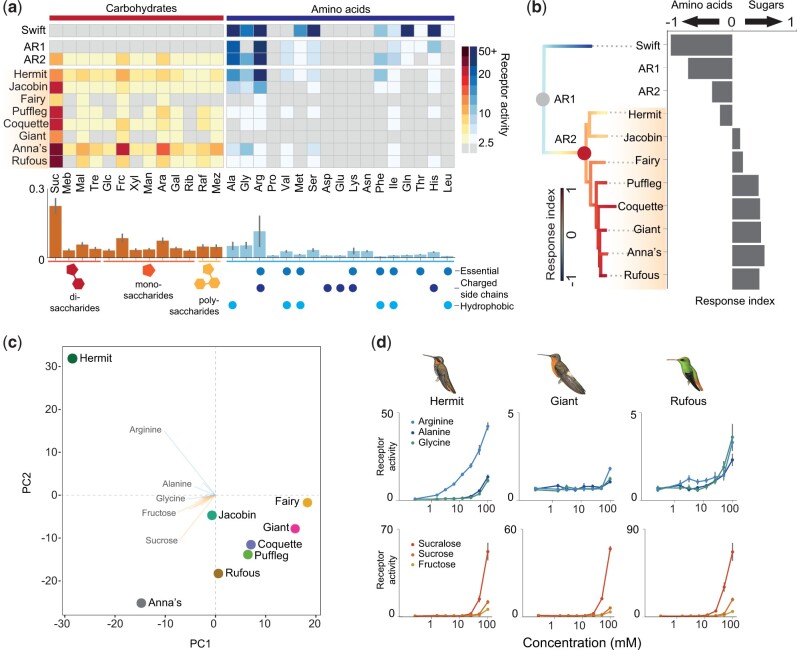
Functional diversity across the hummingbird radiation and the evolution of a sensory trade-off. (a) Responses of apodiform T1Rs to a panel of sugars and amino acids. Sugars (100 mM, n = 6) are shown in orange and amino acids (100 and 50 mM; see Materials and Methods) in blue (all ligands: n = 6). The normalized grand mean (divided by sucralose response) of the response across extant hummingbirds for each ligand is shown (see supplementary fig. 4c, Supplementary Material online, for nonnormalized responses). Sucrose elicits the strongest response of all tested carbohydrates; amino acid responses vary across species, with the strongest responses seen to arginine, alanine, and glycine (see supplementary fig. 4 and supplementary table 2, Supplementary Material online). Sugars are classified as di-, mono-, and polysaccharides; amino acids are categorized according to polarity or hydrophobicity, or whether or not they are able to be synthesized endogenously (nonessential or essential data for birds taken from Klasing [1998])—no clear associations are seen between receptor responses and properties of tested ligands. (b) An index of the relative average sugar-to-amino acid response (see Materials and Methods) across the tested species (including ancestors) demonstrates a functional shift from responding more strongly to amino acids in the swift and ancestors to responding more strongly to carbohydrates in derived hummingbirds: ancestral reconstruction of this index is depicted on the cladogram (left); index values are shown on the right. (c) Phylogenetic principal components analysis (phyloPCA) excluding the swift: the hermit (and to a lesser extent, the jacobin) is distinct from the other tested species. Amino acid eigenvectors are colored blue, eigenvectors for sugars are colored orange. (d) Dose–response curves for three species (saw-billed hermit, giant hummingbird, and rufous-tailed hummingbird, n = 6 per concentration, mean±SE) display dramatic differences in the magnitudes of amino acid responses across hummingbirds, compared with relatively constant responses to carbohydrates.

