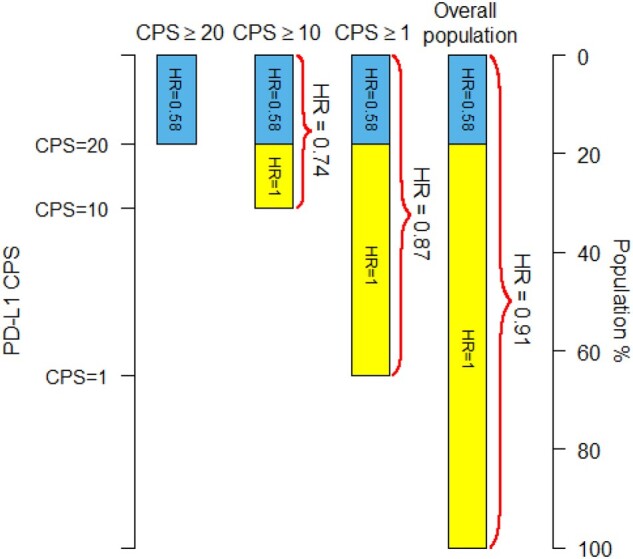
Figure 1.

Estimated hazard ratios (HR) for three PD-L1 subgroups and the overall population under the model that the new over standard treatment hazard ratio is 0.58 for the PD-L1 combined positive score (CPS)≥20 subpopulation (blue in the bars) and the hazard ratio is 1.00 (no effect) in the CPS<20 subpopulation (yellow in the bars). The number of patients and number of deaths in each CPS subgroup as well as the value of the hazard ratio for the CPS≥20 subpopulation are taken from the KEYNOTE-119 trial (see Table 1). Hazard ratios are estimated as weighted averages on the log scale of the individual subgroup hazard ratios weighted by the number deaths in each subgroup. The PD-L1 CPS values on the left-hand vertical axis are scaled to the percentiles of the PD-L1 CPS distribution.
