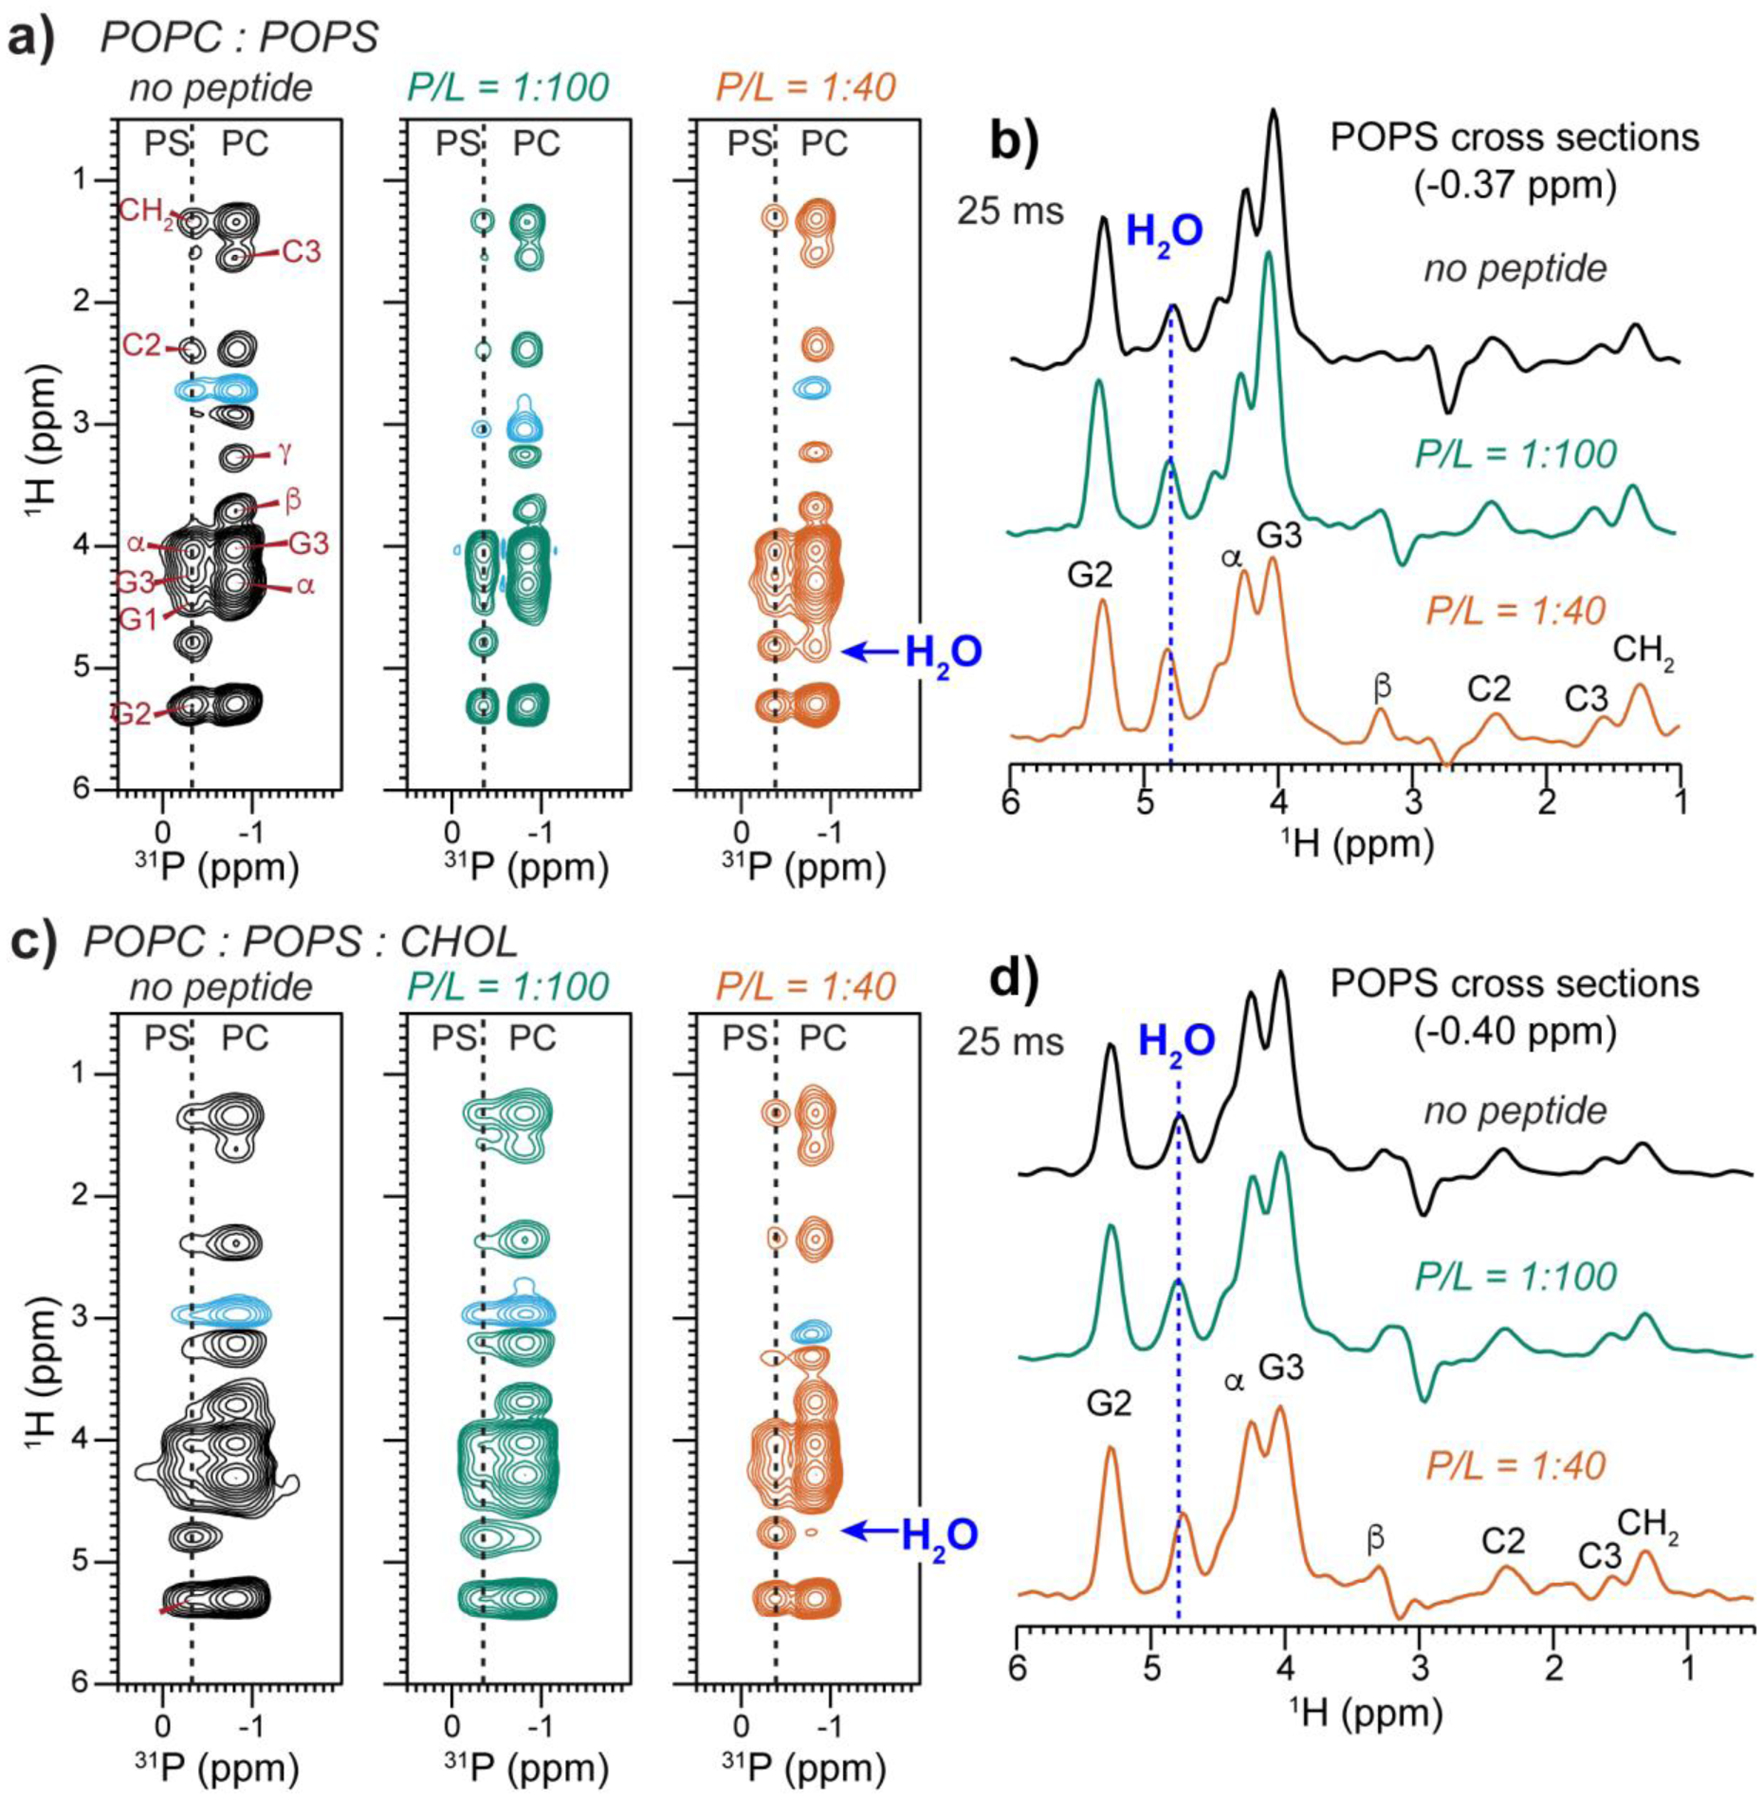
Figure 7.

2D 1H-31P correlation spectra of POPC : POPS membranes without and with MPER-TMD and with and without cholesterol. The spectra were measured with a 1H mixing time of 25 ms at 293 K. (a) 2D spectra of POPC : POPS membranes without the peptide, with P : L of 1:100 (green) and 1:40 (orange). (b) POPS 1H cross sections of the POPC : POPS membranes for the three samples shown in (a). (c) 2D spectra of POPC : POPS : CHOL (7:3:2) membranes without the peptide, with P : L = 1:100 and 1:40. (d) POPS 1H cross sections of the POPC : POPS : CHOL membranes. The peptide moderately increased the water cross peak with POPS.
